LoRaWAN Technology on Air Quality Monitoring for Public Health Protection
Rabeya Anzum
Department of Electrical and Computer Engineering, International Islamic University Malaysia (IIUM), 53100 Kuala Lumpur, Malaysia.
Abstract
In this era of industrialization, air pollution is constantly increasing due to high vehicle mobility and factors like manufactures emissions. A healthy natural environment is vitally important for all eco-systems. Nowadays, cities all over the globe are transforming into smart cities. One of the smart city requirements is ensuring clean air in its premises. Therefore, a scalable and cost-effective air monitoring system is necessary to monitor and control air pollution for smart city deployment. LoRa is a new age low-power wide-area network technology, which is very efficient for air pollution monitoring. Implementation of LoRa technology along with sensors and gateways can offer a wide range of services for natural environment monitoring to ensure public health protection. This paper reviews on LoRaWAN Technology and its application on air quality (AQ) monitoring systems.
Keywords: Air quality, air pollution, Public health, Smart city, LoRaWAN
Clean air is one of the fundamental elements of a healthy life. On average, a person breathes approximately 11,000 liters of air daily (Thu et al., 2018). Air pollution implies to the pollutant concentrations and exposure levels factors in the air. These factors vary at fine Spatio-temporal scales in different regions (Apte et al. 2017; Fecht et al., 2016; Lin et al., 2017) based on air quality. The presence of NO2, SO2, O3, CO, PM1, PM10, and PM 2.5 degrades air quality where particulate matter (PM) is more sensible. The emission of pollutants is responsible for the presence of the invisible gaseous substances in the air. Air containing harmful particles affects mass people and long-term inhalation may lead to a dangerous condition. In a study of the World Health Organisation (WHO), it has been estimated that air pollution causes 36% of deaths from lung cancer, 27% of heart attacks, 34% of strokes, and 35% of deaths from respiratory failure. WHO estimates the death of approximately 7 million people per year due to air pollution (Candia, 2018). In developed countries like the UK, around 29,000 deaths per year counted due to exposure to PM2.5 (Johnston, 2019). Therefore, monitoring the air quality of our surroundings is essential for the sake of public health protection. These long-aged methods for air quality monitoring were seemed to be reliable but sometimes inefficient, expensive, and time-consuming. Also, it is difficult to get the real-time data of the gas and other particulate matter concentration. In recent years, many types of smart sensors embarked on the measurement of air quality (Gungor, 2010; Kumar, 2014). However, most of these systems incur high acquisition as well as high maintenance costs. For instance, a typical air quality monitoring station yearly costs about USD 200,000 and USD 30,000 for maintenance purposes (Zheng et al., 2013). Thus, conventional systems of air pollution monitoring pose expensive for large-scale installation and its long-term maintenance. An affordable and scalable solution is necessary to monitor air quality parameters for public health protection. Internet of Things (IoT) technology is capable of overcoming such challenges. LoRaWAN (low-power wide-area network technology) is one of the emerging IoT technologies, which allow objects to interconnect with each other and exchange data to ensure better performance (Basford et al., 2020). With this technology, many sensors can communicate with each other with the minimum usage of power, bandwidth along with gateway-hardware. Moreover, LoRaWAN technology ensures low-cost continuous monitoring of air quality as an essential part of the smart city initiative.
In this paper, we revisit the most recent LoRaWAN technology and its applications for scalable and affordable air quality monitoring system. The organization of the paper is as follows: This paper is organized as follows: Section II describes LoRaWAN specifications, Section III briefs on LoRa System Module for AQ monitoring and Section IV has concentrated on related air pollution monitoring researches based on LoRaWAN technology. Finally, Section V presents discussion and section VI is the conclusion part.
Nowadays, many wireless network sensor technologies are being used to improve the network lifetime and extend the communication range (Sinha et al., 2017). The sensor autonomy depends on the sensors’ battery power which relies on energy consumption during its sleeping phase. Most of the radio communication technology systems consume a large portion of energy during data transmission and reception (Athreya et al., 2014). Again, the high data rate ensures better data transmission speed and longer sensor sleep duration. Another crucial issue is the communication range, which depends on physical obstacles (buildings) of a surrounding, output power of the device and the receiver’s sensitivity (Reynders et al., 2016). The mostly used WI-FI consumes a huge portion of power for a maximum of 500 m (1Mps) area of communication range (Présent, 2003). Bluetooth is another popular technology, which also consumes high energy and cannot exceed the communication range of 100 m and that’s why it is unable to support a large-sized network. Both the above-mentioned technologies (Bluetooth and WI-FI) follow star topology and unable to cover a large area. Moreover, 2G and 3G communications are expensive and require high power with a long-range. ZigBee REX3DP reaches a communication range of 2 km with a sensitivity of -104 dBm (Rahim et al., 2018). In recent years, several Low-Power Wide-Area Network (LPWAN) technologies namely SigFox Weightless and NB_IoT have been proposed for many IoT applications but none of them is as compatible as LoRa. The flowing figure illustrates the performance comparison of LoRa with other technologies. (Raza et al., 2017).
Figure 1: Comparison of LPWAN Technologies
In 2010, LoRa was introduced as a modulation technology by the French start-up Cycleo, which is later on bought by SEMTECH (a semi-conductor company) in 2012. (Ducrot et al., 2016). LoRa sensitivity reaches to -148 dBm while the Spreading Factor (SF) is 12. The typical range of LoRa is 3 km in the urban area and 14 km on the line of sight (Augustin et al., 2016). The MAC Layer for LoRa Alliance is called LoRaWAN (LoRa for Wide Area Networks), which is a robust solution for IoT long-range communication (Augustin et al., 2016; Raza et al., 2017). LoRa Technology provides solutions for numerous devices to communicate over long-range using star of star topology networks where all gateways are connected to the server via IP standard connections adopting different CF, several SF, and various data rates. Moreover, LoRaWAN technology uses the license-free Industrial, Scientific, and Medical (ISM) band. The radio frequency bands like 169MHz, 433MHz, and 868MHz are used in Europe and 915MHz is in the US (Alliance, 2015). LoRa is a wireless data communication technology, which works using spread-spectrum radio modulation. This spread spectrum modulation technique is derived from chirp Spread Spectrum (CSS) technology. Chirp stands for 'Compressed High-Intensity Radar Pulse'. It is a signal in which frequency either increases or decreases with the time frame. Chirp spread spectrum was developed for radar applications to maintain constant amplitude for passing in the whole bandwidth in a linear or non-linear way. For a certain time, the frequency changes from lowest to highest it is called up-chirp and down-chirp for vice versa. This technique enables the device to transmit signals at a long distance. CSS is also resistive to the Doppler shift (Khutsoane et al., 2017). Thus, LoRa technology offers huge advantages to users. The following table summarizes some of the utilities of LoRaWAN technology:
Table 1: LoRa Advantages
|
Advantages of Lora WAN Technology |
|
|
Long Range |
Long-range even in dense urban areas up to 3km and in rural areas it can reach beyond 5Km. |
|
Long Battery Power |
Batteries last up to 10 years |
|
Low Data Rate |
<10kb/s per message |
|
Star Network Topology |
Star network is more Easily deployable |
|
Low Subscription Cost |
From less than 1 Euro per device per month |
|
Low Number Required Base Station |
Several Thousands of sensors managed by a single base station |
The LoRaWAN technology is presented in two parts- LoRa (physical layer) and the upper layer is Long Range Wide Area Network (LoRaWAN). LoRa Module can connect with many end devices and thus it provides Class A, Class B, and Class C based on different energy consumption and latency features (Ducrot et al., 2016; Alliance, 2015). The Class A category offers the least energy consumption regardless of latency constraints. By using this category end devices are accessible via two receive windows (RX1, RX2) during the transmission of uplink messages. Figure 2 illustrates the opening time for the first receive window which is equal to one second after upstream transmission occurred by the end device.
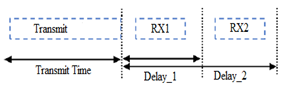
Figure 2: Downlink transmission of LoRaWAN end-device [37]
The device will avoid opening the second window during the downlink transmission of the first window. If it does not happen, the device immediately opens the second receive after the upstream transmission with two seconds duration (Ducrot et al., 2016; Alliance, 2015). Another category Class B where devices are powered by batteries with latency controlled downlink to ensure efficient energy consumption. Synchronization with the server is necessary for this category to avoid any timing drift before switching to these devices. Then the device opens a regulatory slot (ping slot) to get the downlink data sent by the server and forwarded by a single picked gateway. The class C device continues communication and keeps listening on the second RX2 until the end node device starts to send another message. Usually, the last category is designed for manually-loaded devices. Devices of the class C category do not practically implement in class B profile although all the categories must support class A functionality (Ducrot et al., 2016; Alliance, 2015).
A system diagram of an intelligent air quality monitoring platform with LoRa module and wireless sensor network is shown in Fig.3. The diagram shows a typical module for the air quality monitoring system. The input to the system is the concentration value of various particles present in the air. Generally, these data are obtained from the specific sensors located in the city or industrial area. These numerical values are transmitted through the LoRa transmitter and received by the LoRa receiver at the end node where the data can be collected by a computer and sent to the cloud server. These data are easily accessible from the cloud network server by using various applications (e.g. android application in a smartphone) from a remote area.
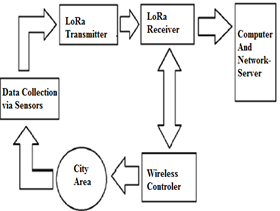
Figure 3: AQ monitoring system module
The prevalent way of estimating air pollution includes collecting air samples and analyzing the samples in laboratories. These long-aged methods were considered reliable but sometimes inefficient and expensive. Also, it is difficult to get the real-time concentration data of the harmful gases and other particulate matters. In recent years, many types of smart sensors embarked on the measurement of the air quality (Saravanakumar et al., 2019; Gungor et al., 2010; Kumar et al., 2014). Many researches have undergone to monitor air pollution where processor bases monitoring conducted to detect the percentages of O3, CO, NO2, and SO2 (Kularatna et al., 2008; Kumar et al., 2014; Mois et al., 2016). A multi-gas sensing system for air quality monitoring using Wi-Fi and Bluetooth was proposed that measures CO, CO2, CH2O, and PM2.5 concentration in the air and allows users monitoring the dataset graph via smartphone (Huang et al., 2018). Another researcher proposed a Zigbee-based outdoor air quality monitoring system where the wireless network used some coordinators, routers, and terminals. Similarly, the air pollution monitoring system using ZigBee networks for ubiquitous-cities was reported by (Liu et al., 2016) for outdoor air quality monitoring, which ranges approximately 270m. The system was capable of detecting CO, NO2, SO2, O3, NO concentrations and transmits data to the routers. Although the system architecture offered high precision, low cost, and low power consumption with the increment of communication range the necessity of using many sensors also increased for connecting via multi-hop. In consequence, the deployment cost increased (He et al., 2016) for this system. Another similar approach was taken to measure the concentrations of gases such as CO, CO2, SO2, and NO2 by Parmar et al. Researchers proposed an IoT based low-cost air pollution monitoring system (Ducrot et al., 2016). The network architecture for this system used a low-cost semiconductor gas sensor with the Wi-Fi module. Kiruthika et al. designed an air quality monitoring system using Raspberry Pi (Bor et al., 2016) where Wi-Fi module was used as a transmitter to collect data and stored in a MySQL database. The drawback of the system was noted as the Wi-Fi has a limited range (approximately within less than 15 meters of the access point) and incurs high power consumption. Moreover, most of the mentioned air quality monitoring systems are based on sensors associated with a server via wired modem, router or short-range wireless access points. These systems are not optimized for low data rates and remote sensing. With the low power wide area network technology, Zheng et al. (Al Hinai et al., 2017) developed a monitoring system. Their technology was expected to enhance coverage as well as lower the power consumption and cost for devices that with limited data rates (Al Hinai et al., 2017). The radical coverage was initially 3 km from the access point (AP) to form a star topology. Furthermore, data were transmitted directly to the access points using the IEEE 802.15k specification and were sent in an interval of 10 seconds. The data were collected from the cloud and later on stored, pre-processed, and analyzed to produce results and make decisions (Al Hinai et al., 2017). In the continuity of the research Bor et al. used LoRa as LPWAN technology to monitor air quality. They initiated a new simulator named LoRaSIM, to test the behaviour of LoRa networks under different settings and various topologies. Thus an IOT-based air pollution monitoring using LoRaWA technology exhibits as an efficient technology in terms of long-range and low-cost ambient monitoring (Bor et al., 2016). Atmospheric Pollutant Monitoring System Based on LoRa star topology network also proved robust for its real-time monitoring (Ma et al., 2018). Researchers have found that the LoRa module can reduce both the power consumption and cost of the device to achieve intelligent environmental monitoring. By utilizing LoRa technology in the IoT provides a reliable and stable data reference source for ambient monitoring (Wang et al., 2019). A study has undergone using LoRa Module with four different electrochemical sensors for CO, SO2, O3, and NO2 showing the concentration of various particles in the air at different times of a year. The proposed model using LoRa module was a low-cost solution. The LoRa technology made the air quality data more stable and accurate as well as it is more efficient in terms of long distant and low power compared to other wireless technologies (Liu et al., 2016). Another research has been conducted in the city of Southampton (UK) stating that LoRaWAN is suitable for city-scale sensor coverage where connectivity is a challenging issue. In their experiment, LoRaWAN technology had been used with sensors to send commands and collect data (Johnston et al., 2019). In recent years many researches have conducted on air quality monitoring using LoRaWAN technology. The following table contains the summary of some recent researches specified by the harmful component used sensor and the essence of the LoRaWAN deployment.
Table 2: LoRaWAN AQ monitoring
|
Author and Year |
Air Quality Component |
Sensor Used |
LoRaWAN Comment |
|
J. Park et al. (2019) |
PM2.5 |
PMS5003T |
The result showed high stability |
|
Shie-Yuan Wang et.al.(2018) |
PM2.5 |
PM2.5 sensor (G7) |
Long term monitoring |
|
Agustin Candia et al. (2018) |
PM2.5, PM 10 |
Nova SDS011 Nova SDS021 y SHINYEI PPD42 |
Optimum range connectivity as a feasible solution |
|
Min Ye Thu et al. (2018) |
CO2 Dust Temperature Humidity |
T6713 SM-PWM01C T960 |
Remarked as a good user interface. |
|
Yushuang Ma et al. (2018) |
SO2 NO2 O3 CO PM2.5 PM10 |
7NE/SO2 7NE/NO2 7NE/O3 7NE/CO2 SDS011 SDS012 |
Reduce power consumption and cost |
|
Sujuan Liu et al. (2016). |
SO2 NO2 O3 CO PM1 PM2.5 PM10 |
SO2-B4 NO2-B42F OX-B4 CO-B4 PLANTOW ER-PM3003 |
A low-cost solution for AQ monitoring. |
|
Steven J. Johnston et al. (2016) |
PM |
PMS5003 PMS7003 |
Capable of working within the 1% duty cycle. |
The emergence of numerous devices for air quality monitoring at a very accessible cost and their application in multiple projects is evident in recent researches (Ducrot et al., 2016). In all cases, the reliability of those used devices is not satisfactory to the demand and also shows different performance for laboratory and real-life scenarios (Wang et al., 2015). The deployment of a few LoRa devices with gateways and sever fully covered the city area for monitoring air quality (Candia et al., 2018). Analyzing the performance of LoRaWAN sensor networks it is observed that this technology is applicable to air quality motoring regardless of environment diversity (Petrić et al., 2016). The massive connectivity of several types of devices is the proof of its scalability (Georgiou and Raza 2017; Adelantado et al., 2017). Moreover low deployment and maintenance cost of LoRaWAN technology devices made the prototype affordable to the customers. The use of wireless sensor networks with the LoRa module made the application more feasible for remote monitoring. Other challenges like durability and deterioration over time of the system arise while using low-cost equipment. In this regard, LoRa technology offers better performance (Wang et al., 2019). The periodic maintenance with the regular calibration of the LoRa devices can ensure a better performance to monitor air quality in any industrial or city area environment (Austin et al., 2015).
All the proposed systems using LoRa communication have performed real-time monitoring to detect different types of atmospheric pollutant concentrations. LoRa module can reduce both power consumption and the cost of the device efficiently. Furthermore, the combination of the sensors and processors together with its low power consumption allows the system to have a sleep function in the device to collect data at high frequency for relatively long periods. The empirical tests proved the robustness of the system. The stability and reliability of LoRaWAN technology cannot be denied, while some of the researchers claim that some of the data may be lost in case of the increased distance between the LoRa base station and the nodes and presence of many obstructions between the base station and the nodes. Therefore, in future work, further, improvement is needed to increase the rage of the device as well as it is the penetration capability in the dense medium. Furthermore, researches on the development of the wireless sensors which are compatible with the LoRa module to monitor other environmental parameters such as soil and water parameters is the time demand. In conclusion, air quality monitoring systems based on LoRa is a viable tool for the measurement of contaminant levels in the air. Advancing the use of this technology; the impact of industrial emissions in the environment can be found and a strategic decision can be taken in long-term planning.
REFERENCES
 This work is licensed under a Creative Commons Attribution 4.0 International License.