This study predicted yield in wheat cultivars with different maturity and planting date, and resistance to yellow rust. The highest yield ranking was detected for the earliest planting date (October) with a yield improvement of 184.55% compared to the latest planting date (January). The highest and lowest yield ranks were determined for the first year (2013-2014) and fourth year (2016-2017), respectively. The first main factor identified the interaction of yellow rust development with the number of rainy days in spring. The maturity planting date and yield predictors contributed to the second factor. The third factor related the resistance index to the Gaussian parameter b of disease development. The regression model justified 90% of the variations in wheat yield. Early planting dates, more rainy days in spring, late maturity of the cultivar, late disease onset, and higher wheat resistance were responsible for the higher yields. Such findings contribute to the future epidemiology of yellow rust, breeding programs for resistant genotypes, and wheat yield estimation.
INTRODUCTION
Yellow (stripe) rust, caused by Puccinia striiformis Westlend. f. sp. tritici Eriksson, has been known as a destructive disease in wheat farming systems worldwide. The development of yellow rust in susceptible wheat cultivars could be intensified by appropriate agronomic and environmental conditions as documented earlier (Naseri & Marefat, 2019). Plot-scale experiments in Iran evidenced that the area under disease progress curve (AUDPC) of yellow rust significantly corresponded to the timing of disease-onset and cultivar maturity, number of days with minimum temperature within 5-12 °C and maximum relative humidity (RH) above 60% over autumn-winter-spring months, resistance index and planting date (Naseri & Marefat, 2019). The next step was attempting to characterize the within and over-season progression of yellow rust on wheat crops following the description of specific and easy-to-use disease progress curve elements (Naseri & Kazemi, 2020). Based on a factor analysis, AUDPC, disease-onset time, Gaussian parameters, maximum disease incidence, and severity predictors justified 80% of the variability in yellow rust development across different wheat cultivars planted at various dates (Naseri & Kazemi, 2020). In another attempt, the spatial and temporal patterns of yellow rust epidemics in irrigated wheat at large scale were predicted according to the mean maximum RH for Aban (from October 23 to November 21), mean minimum temperature for Esfand (from February 20 to March 20), the number of icy days over autumn-winter-spring months, rainy days, days with minimum temperature within 7-8 °C and maximum RH > 60%, and the number of periods involving consecutive days with minimum temperature within 6-9 °C and maximum RH > 60% (Naseri & Sharifi, 2019). Whereas, over the same period (2009-2018) and regions, the two predictors of yellow rust epidemics in rain-fed wheat differed from the disease predictors described for irrigated wheat as mentioned earlier (Naseri, 2022). Although all the above-mentioned studies have potentially updated the best predictors of yellow rust development in wheat, it is still desired to understand how strongly such influential agronomic, climatic, and disease predictors are linked to wheat productivity. Moreover, we should know the complex interactions among planting date, resistance level, yellow rust progress, wheat maturation, and weather. The interaction of yellow rust with limited combinations of these agroecological factors has been studied earlier to estimate wheat yield (Murray et al., 1994; Gladders et al., 2007; Sharma-Poudyal & Chen, 2011; Lavilla, 2022). All these agroecological factors affect yellow rust and wheat yield when they interact with each other during the growing season at the field scale. Thus, we need an advanced estimation of wheat production and breeding programs according to wisely selected descriptors of agroecosystems.
In Iran, the effectiveness of various levels of race-specific and slow rusting resistance was evaluated in field plots under severe yellow rust epidemics that occurred during 2011-2013. Then, the wheat yield was predicted according to the AUDPC, apparent infection rate, final rust severity, and coefficient of infection determined for 16 wheat cultivars and lines (Safavi, 2015). The other yield estimations in wheat crops affected by yellow rust have been conducted using such common disease progress descriptors. Such yield estimates have been reported from Australia (Murray et al., 1994), Argentina (Lavilla, 2022), the UK (Gladders et al., 2007), and the USA (Sharma-Poudyal & Chen, 2011). Thus, most of the previous reports on predicting wheat yield reduced by yellow rust epidemics have been conducted based on measuring non-specific disease descriptors as mentioned above. Furthermore, interactions of yellow rust progress predictors with effective agronomic and environmental characteristics (Naseri & Marefat, 2019; Naseri & Sharifi, 2019; Naseri & Kazemi 2020) in estimating wheat yield remained unclear. Therefore, a more accurate and up-to-date simulation of wheat yield according to the multiple disease measurements within and over growing seasons based on specific yellow rust progress curve elements is still required. To meet this requirement, assessing the magnitude of associations of specific yellow rust progress curve elements with agroecological variables appears to be a necessary prerequisite to predict wheat yield more concisely. This better understanding is also required to breed more resistant wheat cultivars with longer-lasting genetic resistance.
According to Luo’s (2008) recommendations, the principal component analysis (PCA) leads to a minimum problem with selecting the best-fitted variables for a multiple regression model. Indeed, it is also crucial to maximize the data variance following the treatment of experimental plots with influential agronomic traits such as cultivar and planting date across several growing seasons (Naseri & Kazemi 2020). It is believed that this high variability in the dataset could increase the descriptive value of variables (Kranz, 2003). Hence, the following objectives were considered in this research to: (i) determine predictive values of cultivar resistance index, crop maturity time, air temperature, planting date, relative humidity, rainy days, and yellow rust progress curve elements; (ii) examine associations between the selected agro-ecological and disease progress curves; (iii) model wheat production according to this combination of agro-ecological and yellow rust predictors.
MATERIALS AND METHODS
Experiments
From the autumn of 2013 to the summer of 2017, the progression of yellow rust in commercial winter wheat (Triticum aestivum L.) cultivars was characterized across 282 experimental field plots prepared as presented in Table 1. Experiments were conducted according to a split-plot design with three replicates per treatment. To maximize variations in the development of yellow rust epidemics across the experimental plots, different dates of planting and cultivars of wheat were considered in the current four-season investigation. Eight bread wheat cultivars registered by the Seed and Plant Improvement Institute, Karaj, Iran were involved in experiments (Naseri & Kazemi, 2020). According to the maximum yellow rust severity rating during the current study (2013-2017), the resistance levels of these eight wheat cultivars were classified as moderately resistant for Pishgam and susceptible for the other cultivars examined (Naseri & Marefat, 2019).
Table 1. Experimental plots properties, factor categories, and measurements conducted at the research site, Kermanshah, Iran
|
Assessments |
Year |
Plot no. |
Plot size (m2) |
Experimental factors |
|||
|
Sowing time (Main plot) |
Cultivar (Subplot) |
Pedigree |
Year of release |
||||
|
Yellow rust |
2013-14 |
72 |
19.2 |
Oct. 10, Nov. 7, Dec. 3 & 31 |
Bahar |
ICW84–0008-013AP-300 L-3AP-300 L-0AP |
2007 |
|
Yield (kg/ha) |
2014-15 |
63 |
24 |
Oct. 12, Nov. 14, Dec. 19 |
Baharan |
KAUZ/PASTOR//PBW343 |
2014 |
|
|
2015-16 |
63 |
6 |
Oct. 27, Dec. 13 & 30 |
Chamran II |
Attila50Y//Attila/Bacanora |
2013 |
|
|
2016-17 |
84 |
6 |
Oct. 11, Nov. 15, Dec. 11, Jan. 5 |
Parsi |
Dove^s^/Buc^s^//2*Darab |
2009 |
|
|
|
|
|
|
Pishgam |
Bkt/90-Zhong87 |
2008 |
|
|
|
|
|
|
Pishtaz |
Adlan/Ias58//Alvand |
2002 |
|
|
|
|
|
|
Sirwan |
PRL/2*PASTOR |
2011 |
|
|
|
|
|
|
Sivand |
KAUZ^s^/Azadi |
2009 |
|
Field plot properties: - Cool temperate climate: annual mean temperature 13.7 °C & rainfall of 479.8 mm - Fertilization: 225 kg/ha urea & 50 kg/ha superphosphate - Latitude 34°7´ north, longitude 46°28´ east - No fungicide application - Pesticide application: 180 kg/ha Decis - Sprinkler irrigation every 7–10 days - Weather data obtained from the weather station adjacent to the research site |
|||||||
Datasets
The yellow rust incidence was measured as the percentage of diseased plants at three spots observed per plot (Naseri & Marefat, 2019). The severity of wheat yellow rust was rated weekly as the percentage of leaf area pustulating for the three newest leaves of 3-5 randomly tested plants per plot (Naseri & Marefat, 2019). The progression of yellow rust was evaluated across 282 plots (2013-2017) according to the disease severity recorded at 4-6 assessment times depending on the length of epidemics developed each growing season. This resulted in 1419 disease measurements at highly diversified levels which were needed to improve the accuracy of the yield-predicting model.
Analysis
To characterize the progression of yellow rust in wheat cultivars, the disease severity dataset was subjected to modeling (Naseri & Kazemi, 2020). The progression of wheat yellow rust over the growing seasons was characterized based on the following disease progress curve elements: (1) the disease onset time; (2) the AUDPC calculated for the disease severity ratings over time; (3) maximum disease incidence over the study years; (4) maximum disease severity; (5) Gaussian curve parameters (Naseri & Kazemi, 2020). The GENSTAT (Payne et al., 2009), which commonly fits standard curves by maximum likelihood, was used for all the statistical procedures used in this investigation. The Gaussian model indicated the best fitness for the progression of yellow rust (Naseri & Kazemi, 2020). In this model, a describes the initial value or the constant term, b describes the height of the curve’s peak, m describes the position of the peak’s center, s (the standard deviation) describes the width of the Gaussian bell, and x describes the time intervals (Table 2).
Table 2. Variables studied in commercial wheat cultivars differing in planting date, maturity time, and resistance index under yellow rust epidemics
|
Variables |
Variable definition/levels |
|
||||||
|
Weather |
Number of days with minimum temperature within 5-12 °C & maximum relative humidity ≥ 60% |
|||||||
|
Number of rainy days in spring |
||||||||
|
Maturity time |
Bahar |
Baharan |
Chamran II |
Parsi |
Pishgam |
Pishtaz |
Sirwan |
Sivand |
|
(Days from planting) |
255-267a |
251-267 |
251-268 |
247-268 |
247-266 |
250-268 |
251-269 |
252-270 |
|
Planting date |
Early |
Optimum |
Late |
Very late |
||||
|
October |
November |
December |
Early January |
|||||
|
Resistance index |
Bahar |
Baharan |
Chamran II |
Parsi |
Pishgam |
Pishtaz |
Sirwan |
Sivand |
|
30b |
30 |
0 |
40 |
70 |
50 |
10 |
20 |
|
|
Yellow rust |
The area under the disease progress curve |
AUDPC |
||||||
|
Disease onset time |
Early & Late |
|||||||
|
a + b*Gauss((x - m)/s) |
Gaussian parameter b, m, s |
|||||||
|
Maximum disease over the season |
Incidence & Severity |
|||||||
a Ranges of maturity time differing between cultivars, planting dates, and years.
b Resistance index = 100 – Highest disease severity rating over the four-year study.
A parametric analysis of variance was performed on yellow rust severity and yield datasets collected from experimental plots over four growing seasons as reported earlier (Naseri & Marefat, 2019; Naseri, 2022). Therefore, mean values for the disease and yield for different levels of cultivar, planting date, assessment time, and growing season were provided by previous publications. In the present research, attempts were made to classify factors (cultivar, disease onset, growing season, planting date, and resistance index) based on a non-parametric analysis. Thus, this analysis provided further information on rankings of factor classifications needed for one-way interpretations of factor effects. To compare wheat yield between factor levels, a Kruscal-Wallis one-way ANOVA by H-test was used to rank the effects of disease onset time, maturity time, planting date, resistance index, and study year on yield. Using a factor analysis (FA), interrelationships among 13 agronomic, weather, wheat yield, and yellow rust progress predictors were determined according to the principal factors receiving eigenvalues (data variance proportion) ≥ 1.0. To predict productivity in wheat cultivars attacked by yellow rust, it was essential to reduce the number of predictors for fewer collinear yellow rust predictors for regression modeling. Hence, this reduction of collinear variables was performed with the help of this FA. For regression modeling, the adjusted coefficient of determination (R2) and Mallows Cp were used for stepwise selecting procedures (Brusco & Stahl, 2005; Naseri & Sasani, 2020). Furthermore, the graphical appraisal of normally distributed residuals, F-test, and R2 were used for evaluating the model fitness (Naseri & Sabeti, 2021).
RESULTS AND DISCUSSION
Kruscal-Wallis one-way ANOVA
To compare wheat yield between factor levels, a Kruscal-Wallis one-way ANOVA according to the H-test was used to rank the effects of cultivar, disease onset time, planting date, resistance index, and year on yield. The productivity in the eight cultivars of wheat was not affected (Chi P > 0.05) by cultivar, disease onset time, and resistance index (Table 3). The highest yield ranking was determined for the early planting class of the planting date factor, which affected (Chi P < 0.001; mean H = 32.93) wheat yield. Then, the rankings of wheat yield decreased as the planting was delayed from optimum to late and very late plantings. This suggested that the ranking of wheat yield in very late planted plots improved by 184.55% when the cultivars were planted early in October over the four growing seasons. Planting wheat cultivars on an optimum date (November) improved yield ranking by 153.09% in comparison with the very late planting. For the year factor, which affected (Chi P < 0.001; mean H = 36.25) the productivity of wheat cultivars, the highest and lowest yield rankings were detected for the first (2013-2014) and the fourth (2016-2017) years of the study, respectively. Therefore, the Kruscal-Wallis one-way ANOVA results based on the H-tests demonstrated that early plantings of the eight wheat cultivars in the 2013-2014 experiments provided the highest yield levels compared to the other classes of planting date and year factors.
Table 3. Kruskal-Wallis one-way ANOVA ranked yield levels for wheat cultivar, yellow rust onset, planting date, maturity time, resistance index, and year factors
|
Factors |
Factor levels |
|
||||||
|
Cultivar |
Bahar |
Baharan |
Chamran II |
Parsi |
Pishgam |
Pishtaz |
Sirwan |
Sivand |
|
Mean H = 8.97 |
64.29 |
35.57 |
49.21 |
54.43 |
31.30 |
47.21 |
51.50 |
44.29 |
|
Chi P < 0.225 |
|
|
|
|
|
|
|
|
|
Planting date |
Early |
Optimum |
Late |
Very late |
||||
|
Mean H = 32.93 |
66.67 |
59.30 |
39.33 |
23.43 |
||||
|
Chi P < 0.001 |
|
|
|
|
||||
|
Resistance index |
Bahar/30 |
Baharan/30 |
Chamran II/0 |
Parsi/40 |
Pishgam/70 |
Pishtaz/50 |
Sirwan/10 |
Sivand/20 |
|
Mean H = 6.74 |
64.29 |
64.29 |
49.21 |
48.14 |
31.30 |
47.21 |
51.50 |
44.29 |
|
Chi P < 0.345 |
|
|
|
|
|
|
|
|
|
Yellow rust onset |
Early |
Late |
||||||
|
Mean H = 1.50 |
41.07 |
49.35 |
||||||
|
Chi P < 0.220 |
|
|
||||||
|
Year |
2013-2014 |
2014-2015 |
2015-2016 |
2016-2017 |
||||
|
Mean H = 36.25 |
67.71 |
59.74 |
41.07 |
25.82 |
||||
|
Chi P < 0.001 |
|
|
|
|
||||
Factor analysis
According to the results of FA, the three principal factors explained 74.14% of the variability in wheat maturity and planting date, resistance index, weather, yellow rust progress, and yield datasets (Table 4). These datasets were collected from the eight commercial wheat cultivars planted at different dates over the four growing seasons. The first principal factor, justifying 44.27% of the total data variance, evidenced the highest loading value for the contributions of the disease onset date (0.37) and Gaussian parameter m (-0.37), and the predictor of rainy days in spring (-0.37). Furthermore, the AUDPC and maximum disease severity showed negatively moderate contributions in the first principal factor. Among the seven yellow rust progress predictors, the highest significant contributions in the first principal factor were determined for the disease onset date and Gaussian parameter m predictors. Hence, the disease onset was considered an easier-to-assess disease predictor for the following regression analysis. Furthermore, this factor of the FA was defined as the factor of yellow rust progress in interaction with the weather predictor. The maturity time, planting date, and wheat yield predictors contributed significantly to the second principal factor accounting for 18.13% of total data variance. The maturity and planting date predictors provided negatively moderate contributions in the second principal factor, while wheat yield contributed with a highly positive loading. Thus, the second principal factor was regarded as the factor of wheat characteristics. The third principal factor, explaining 11.74% of the data variance, indicated a moderately negative loading for the Gaussian parameter b of yellow rust and a highly positive loading for the resistance index. This factor was defined as the factor of yellow rust progress in association with the resistance level of wheat cultivar (Table 4). This FA simplified the development of the regression model by determining the predictive values of disease, weather, and wheat variables studied at an experimental plot scale over four growing seasons.
Table 4. Factor analysis of yellow rust progression in wheat cultivars differing in planting date, resistance index, and maturity time
|
Variables |
|
Principal components |
||
|
1 |
2 |
3 |
||
|
Maturity time |
|
-0.20 |
-0.44 |
-0.32 |
|
Planting date |
|
-0.16 |
-0.47 |
-0.32 |
|
Resistance index |
|
0.08 |
-0.21 |
0.55 |
|
Yellow rust |
The area under the disease progress curve |
-0.36 |
0.20 |
-0.07 |
|
|
Disease onset date |
0.37 |
-0.01 |
-0.24 |
|
|
Gaussian parameter b |
0.01 |
0.12 |
-0.44 |
|
|
Gaussian parameter m |
-0.37 |
0.05 |
0.25 |
|
|
Gaussian parameter s |
-0.32 |
0.10 |
0.10 |
|
|
Maximum disease incidence |
-0.31 |
0.26 |
-0.24 |
|
|
Maximum disease severity |
-0.35 |
0.23 |
-0.19 |
|
Weather |
Nd min temp 5-12 °C & max RH ≥ 60%a |
-0.24 |
-0.28 |
0.16 |
|
|
Number of rainy days in spring |
-0.37 |
-0.09 |
0.20 |
|
Yield (kg/ha) |
|
0.06 |
0.52 |
0.07 |
|
Eigenvalues |
5.76 |
2.36 |
1.53 |
|
|
Variation (%) |
44.27 |
18.13 |
11.74 |
|
|
Accumulated variation (%) |
44.27 |
62.40 |
74.14 |
|
a Number of days (autumn-winter-spring) with minimum temperature within 5-12°C & maximum relative humidity ≥ 60%.
*Bold numbers indicate significant loadings ≥ 0.35.
Regression analysis
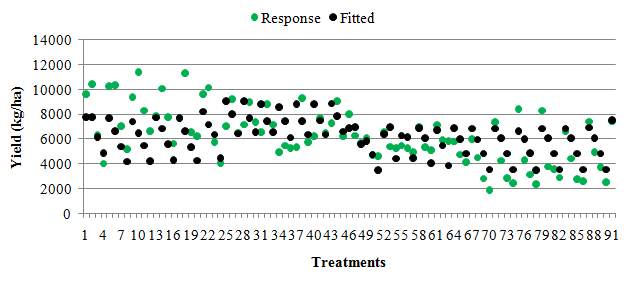
The predictive values of cultivar resistance, disease, maturity, planting dates, and weather variables were determined according to the FA results. Independency of the principal factors provided by this FA characterized the best predictors of wheat yield in the datasets examined. The multivariate regression analysis justified 90% of variations in yield (F probability = 0.001; R2 = 0.90) of eight commercial wheat cultivars planted at different dates across 282 plots over the four growing seasons (Table 5). Therefore, this multivariate regression model was developed to predict wheat yield according to the cultivar resistance index, maturity and planting date, weather, and yellow rust progress predictors. The yellow rust onset time was identified as the most predictive variable describing yellow rust fluctuations across cultivars, planting dates, and growing seasons studied based on the FA results. The selection of predictors to fit the best model was performed using the stepwise procedure. The linear combination of the disease onset time, maturity and planting date, resistance index, and weather predictors corresponded significantly with the dependent variable, wheat yield (kg/ha). Planting date and weather predictor were negatively linked to wheat yield variables. The two-way interaction of disease onset and resistance index predictors, and maturity time predictor corresponded positively with the yield variable. The simple regression analysis demonstrated that the observed data for wheat yield were significantly linked to the data fitted by the yield model (Figure 1). Thus, this model suggested that higher yield levels corresponded with an earlier planting date, further rainy days in spring months, a later maturity of wheat cultivar, a delayed onset of yellow rust, and a greater wheat resistance index.
Table 5. Multiple regression analysis of wheat yield (kg/ha) based on factor analysis of maturity time, planting date, resistance index, weather, and yellow rust progress predictors (R2 = 90%; P < 0.001)
|
Predictors |
Parameter estimates |
Standard errors |
t-probability |
|
Disease onset time × Resistance index |
0.10 |
0.04 |
0.010 |
|
Maturity time |
48.00 |
3.48 |
<0.001 |
|
Planting date × Number of rainy days in spring |
-1341.00 |
186.00 |
<0.001 |
|
|
|
Figure 1. Fitted values regressed to observed values of yield in eight commercial wheat cultivars planted at different dates and affected with yellow rust; the treatments axis refers to averages of yield for three replicate plots treated with cultivar and planting date (in total 282 plots) |
The current findings advanced our understanding of yield estimates according to epidemiological and agroecological aspects of wheat cropping systems affected by highly diverse levels of yellow rust. Moreover, the predictors of yellow rust progress had been specifically described for the development of disease epidemics in wheat cultivars planted at different dates and seasons to diversify disease intensity and spread across 282 experimental plots (Naseri & Kazemi, 2020; Iryna et al., 2022). As advised earlier (Kranz, 2003; Naseri & Kazemi, 2020), such a diverse variability in disease levels improved the predictive values of yellow rust progress curve elements to estimate wheat yield. This is also supported by the present regression model which explained a high proportion (0.90) of yield variance in wheat cultivars treated with effective planting dates over four growing seasons. According to several previous documents (Murray et al., 1994; Lavilla, 2022), it seems very difficult to justify such a high proportion of wheat yield variations by using only common and non-specific yellow rust progress curve elements. For instance, yield loss in wheat cultivars decreased with increasing temperature during grain development in southern New South Wales, Australia (Murray et al., 1994). Hence, the Australian model (Murray et al., 1994; Nizkii et al., 2022) explained up to 85% of variations in yield losses across field experiments using a common disease descriptor which defined the proportion of leaf area postulating. Furthermore, Australian experts predicted yield loss in wheat based on the mean daily maximum temperature which has been reported as a misleading climatic factor for epidemiological studies on wheat-yellow-rust pathosystems (Sharma-Poudyal & Chen, 2011). Future research might involve further influential agronomic, environmental, and disease factors to improve wheat yield estimations.
In the USA, Sharma-Poudyal and Chen (2011) developed regression models to predict wheat yield loss according to weather factors effective on the occurrence of yellow rust epidemics. They reported winter temperature and rainy days as the most descriptive predictors of yield loss to yellow rust based on the historical disease severity data collected from 1993 to 2007 in winter wheat. In Iran, we found that suitable days for yellow rust progress corresponded not only with the minimum temperature within 5-12 °C but also with maximum RH ≥ 60% at both large (Naseri & Sharifi, 2019) and plot (Naseri & Marefat 2019) scales. Thus, the number of days (autumn-winter-spring) with a minimum temperature of 5-12 °C and maximum RH ≥ 60% was used to predict yellow rust epidemics. However, we observed a very low predictive value due to the non-significant association of this weather predictor with the other variables of maturity and planting date, resistance index, and yellow rust progress to model yield. This observation might be attributed to the reduced predictive potential of this temperature-humidity variable when compared to the above-mentioned variables. However, the number of rainy days in spring indicated a significant contribution in the first principal factor which represented a linear relationship of 13 diseases, weather, and wheat predictors studied in the current research. Moreover, this FA signified the association of an earlier yellow rust onset, greater AUDPC and maximum disease severity, and a higher peak of disease progress curve with further rainy days in spring months. Hence, the number of rainy days in spring was considered as a relevant weather predictor for the regression analysis of wheat productivity. Therefore, this is the first report of a stronger linkage of spring rainy days to both yellow rust progress (based on the factor analysis) and wheat yield (based on the regression analysis) when compared with the monthly averages of minimum temperature and maximum relative humidity in autumn, winter and spring seasons. This disagreement on the temperature variable between the present study and the USA findings might be due to ignoring the remarkable associations of wheat maturity, planting date, disease onset, and cultivar resistance with yield by Sharma-Poudyal and Chen (2011).
There are several documents on planting dates impacting the development of yellow rust epidemics in wheat crops (Gladders et al., 2007; Naseri & Marefat, 2019; Naseri & Kazemi, 2020). However, the association of planting date with yield in wheat crops affected by yellow rust epidemics is little understood. According to the present Kruscal-Wallis one-way ANOVA and factor analysis, the date of planting commercial wheat cultivars differing in maturity time and level of disease resistance corresponded significantly with the yield. This suggested that early plantings of wheat cultivars in October produced higher yield levels than later plantings in December and early January under prevailing environmental conditions (Naseri & Sharifi, 2019) during the 2013-2017 years in Kermanshah, Iran. This noticeable relationship was also confirmed by the regression model developed to predict wheat yield according to the five predictors of yellow rust onset, wheat maturity, planting date, resistance index, and rainy days. Furthermore, the dependence of planting date on the number of rainy days in spring based on the model demonstrated that early plantings of wheat cultivars in October followed by further rainy days in spring might produce the highest yield. Such novel findings assist with organizing future studies and considering rainy days in spring to optimize planting dates for the sustainable management of wheat yellow rust.
Mapuranga et al. (2022) reviewed previous findings on harnessing genetic resistance to rust in wheat when efficient methods of integrated rust management lead to the development of more durable resistant cultivars. Naseri and Marefat (2019) reported the significant association of planting date with the resistance index of wheat cultivars to predict the intensity of yellow rust epidemics. Therefore, more accurate estimates of yield affected by planting date and resistance level are needed for the sustainable management of wheat yellow rust. In Iran, the effectiveness of various levels of race-specific and slow rusting resistance was evaluated in field plots under severe yellow rust epidemics that occurred during 2011-2013. Then, the wheat yield was predicted according to the AUDPC, apparent infection rate, final rust severity, and coefficient of infection determined for 16 wheat cultivars and lines (Safavi, 2015; Dashti & Mirzakhani, 2021). However, previous investigations ignored the noticeable impacts of planting date on yellow rust development in wheat crops differing in the disease resistance level and on the subsequent yield. The present findings explained 90% of yield variations across a wide range of yellow rust progress patterns studied during four growing seasons in various wheat cultivars planted at different dates. Moreover, using the specific yellow rust progress curve elements to predict wheat yield produced under such high variability in the disease and yield datasets resulted in the accuracy and predictive value of the regression model as great as 90%. Thus, this remarkable association of planting date and disease resistance could be considered in future research to improve not only the accuracy of disease and yield estimations but also the durability of genetic resistance with the help of an appropriate planting date restricting the disease pressure on resistant cultivars.
Gladders et al. (2007) found significant associations of yellow rust incidence with agronomic and climatic variables including disease resistance rating, frost, seed treatment, and foliar fungicide application. However, the current findings evidenced a non-significant association of maximum disease incidence with the other agronomic and climatic variables according to the factor analysis results. Whereas, the other yellow rust progress curve elements such as the AUDPC, disease onset time, Gaussian parameters b and m, and maximum disease severity were linked to either the number of rainy days in spring or the resistance index. This suggested that a single disease progress predictor in particular the disease incidence may be insufficient to simulate yield in wheat cultivars affected by yellow rust epidemics. Furthermore, it could be concluded that the disease severity provides a greater predictive value than the disease incidence in estimating yield in wheat-yellow-rust pathosystems.
CONCLUSION
In conclusion, the current findings provided a systematic insight into the complicated interactions of wheat yield with yellow rust progress, maturity time, planting date, cultivar resistance, and weather studied under field conditions. This research reports novel achievements on a reasonable number of agroecological and disease factors affecting wheat productivity. Such new information helps to develop more durable resistant cultivars with improved production from sustainable agriculture viewpoints. Furthermore, the durability of wheat resistance to yellow rust appears to benefit from early planting dates that improved productivity, particularly in rainy springs.
ACKNOWLEDGMENTS: None
CONFLICT OF INTEREST: None
FINANCIAL SUPPORT: This study was funded by the Iranian Agricultural Research, Education & Extension Organization, project 2-55-16-94165.
ETHICS STATEMENT: The research presented in this manuscript did not involve any animal or human participants, therefore no ethics approval is required.
Dashti, A., & Mirzakhani, K. (2021). Designing a model for audience attraction in public libraries tf Tehran 1st region. Journal of Organizational Behavior Research, 6(1), 243-255.
Gladders, P., Langton, S. D., Barrie, I. A., Hardwick, N. V., Taylor, M. C., & Paveley, N. D. (2007). The importance of weather Sharma-Poudyal, D., & Chen, X. M. (2011). Models for predicting potential yield loss of wheat caused by stripe rust in the US Pacific Northwest. Phytopathology, 101(5), 544-554and agronomic factors for the overwinter survival of yellow rust (Puccinia striiformis) and subsequent disease risk in commercial wheat crops in England. Annals of Applied Biology, 150(3), 371-382.
Iryna, L., Dmytro, L., Kseniia, M., Olena, B., Alina, S., & Dmytro, M. (2022). Rational pharmacotherapy of respiratory diseases in the COVID-19 pandemic. International Journal of Pharmaceutical Research and Allied Sciences, 11(1), 55-60.
Kranz, J. (2003). Comparison of temporal aspects of epidemics: The disease progress curves. In Comparative epidemiology of plant diseases (pp. 93-134). Berlin, Heidelberg: Springer Berlin Heidelberg.
Luo, W. (2008). Spatial/temporal modelling of crop disease data using high-dimensional regression (Doctoral dissertation, University of Leeds).
Mapuranga, J., Zhang, N., Zhang, L., Liu, W., Chang, J., & Yang, W. (2022). Harnessing genetic resistance to rusts in wheat and integrated rust management methods to develop more durable resistant cultivars. Frontiers in Plant Science, 13, 951095.
Naseri, B. (2022). Predicting rain-fed wheat yellow rust epidemics in Kermanshah province. Applied Entomology and Phytopathology, 90(1), 63-75.
Naseri, B., & Kazemi, H. (2020). Structural characterization of stripe rust progress in wheat crops sown at different planting dates. Heliyon, 6(11), e05328.
Naseri, B., & Marefat, A. (2019). Wheat stripe rust epidemics in interaction with climate, genotype and planting date. European Journal of Plant Pathology, 154, 1077-1089.
Naseri, B., & Sabeti, P. (2021). Analysis of the effects of climate, host resistance, maturity and sowing date on wheat stem rust epidemics. Journal of Plant Pathology, 103(1), 197-205.
Naseri, B., & Sasani, S. (2020). Cultivar, planting date and weather linked to wheat leaf rust development. Cereal Research Communications, 48, 203-210.
Naseri, B., & Sharifi, F. (2019). Predicting wheat stripe rust epidemics according to influential climatic variables. Journal of Plant Protection Research, 519-528.
Nizkii, S., Kodirova, G., & Kubankova, G. (2022). Lysine - An absolutely essential amino acid in soybean proteins from the Russian selection. International Journal of Pharmaceutical Research and Allied Sciences, 11(1), 51-54.
Payne, R. W., Murray, D. A., Harding, S. A., Baird, D. B., & Soutar, D. M. (2009). Genstat®, VSN International, Oxford, UK.
Safavi, S. A. (2015). Effects of yellow rust on yield of race-specific and slow rusting resistant wheat genotypes. Journal of Crop Protection, 4(3), 395-408.
 This work is licensed under a Creative Commons Attribution 4.0 International License.