Survey of Geomorphic and Morphotectonic Indixes to Assessment Active Tectonics in Khorram Abad River
Habib Ariantabar1*, Peyman Rezaei2
1 Ph.D. of Geomorphology, Lorestan University, Kermanshah, Iran.
2 Ph.D. Student of Geomorphology University of Kharazmi, Tehran, Iran.
ABSTRACT
Khorram Abad plain is situated on the folded Zagros unit and Khorram Abad River, as a distributary of the Karkheh River, flows through this plain. Since Khorram Abad’s hidden and active fault is positioned in this region, it is severely influenced by the neotectonic activities of this fault. Therefore, the present study aimed at the investigation of the effect of this fault’s activities on the morphological activities of Khorram Abad River using remote-sensing techniques, geometrical indices, aerial photos, and satellite images and field measurements. To do so, the river’s route was seminally divided into five subareas for attaining more precise results and the aerial photos were taken in 1955 were compared and Google Earth’s 2016 images were processed in GIS. Digitization of the river’s route in AutoCAD enabled the specification of the geometrical indices like river’s slope and gradient and sinuosity amounts for the abovementioned five subareas; the longitudinal profiles and the changes in the alluvial terraces were measured in field observations. The values obtained for Khorram Abad River’s geometrical indices indicated that Khorram Abad’s anticline and its upstream regions are upheaving and the downstream regions are subsiding or maintaining their previous positions. This ascending trend has been followed by an average gradient along the river’s route and is manifested in the form of a change in the number of the tributaries and geometrical properties of the river.
Keywords: River’s morphological evolutions, River’s riffle, Khorram Abad, Hidden fault
The reaction of the river systems to the tectonic movements, land-use changes, and climatic changes is amongst the active parts in the geomorphological studies. The reason for this issue is firstly the researcher’s tendencies towards the development of quantitative theories regarding the processes and various kinds of fluvial reactions to the abovementioned factors and secondly the possibility of reconstructing the conditions governing the past times through investigation of the morphology of today’s rivers (Zamolyi et al, 2009). The occurrence of the tectonic activities in a region that may cause obduction, subsidence and/or horizontal and orthogonal dislocations along the faults has tangible effects on the fluvial systems (Pérez et al, 2010; Bull, 2007) in such a way that the result would be changed in the slopes of the valleys’ floor hence the transformation of the rivers’ geometrical properties (Keller and Pinter, 1996; Peters and Van Balen, 2007; Schoenbohm et al, 2004; Bull, 2007). The effects of these activities on the rivers appear in the form of a change in the type of the fluvial network and river’s sedimentation or rummage. The slackened river’s rummage in contrast to the upheaval of a region, the disintegration of the existent waterway network and its fast speed would be accompanied by the intensification of erosion atop of the water channels (Jain et al, 2005; Keller and Printer, 1996). It can be stated that there is a sort of interaction between the tectonic movements and fluvial system’s variations and that the fluvial systems’ reactions to the tectonic activities depend on the intensity and type of these activities and the relative size of the river (Peters and Van Balen, 2007; Keller and Pinter, 1996). For example, the orthogonal displacements in several-centimeter scales along a fault are only capable of diverting the small ditches and the creation of disjoints along its course. However, in case of the tectonic movements’ being intensified in a slope range between 0.7% and 2%, the increase in the riverbed’s slope would be followed by the increase in the sinuosity and the reduction in the slope in such zones can be accompanied by the reduction in the sinuosity of the river’s meanders (Jain et al, 2005; Keller and Pinter, 1996) (Figure 1). Morphological changes in tectonic activities are not solely specific to visible faults. In some of the cases that the fault’s disintegration has not completely surfaced and/or some of the natural factors like quaternary alluvia cover these faults and contours, they are called hidden faults, the activities of which, can have a large deal of effect like the visible faults on the region’s morphology (Bonforte et al, 2013). For instance, tectonic activity along the faults that are hidden in the quaternary sediments in Utah-Vila Franca region, Portugal, has caused the elevation of and change in the essential local level of Tagus River and this has resulted in the deepening of the channel, river’s diversion and erosion in the upstream region (Carvalho et al, 2006). In the Kumroch region in the Kamchatka Peninsula, in Russia, as well, the activity of the hidden faults has been recognized as the factor causing the transversal development and deepening of the river’s longitudinal profile (Sarah et al, 2013). Khorram Abad Fault is a specimen of hidden faults.
Because Khorram Abad River passes over Khorram Abad hidden thrust fault, the morphological relationship of Khorram Abad River with the tectonic activities of this fault in the northern and southern sections of Khorram Abad within the distance from Shabikhun Strait, some 30 kilometers to the northwestern side of Khorram Abad, up to a 20-kilometer distance in the southern side of Khorram Abad with a general slope of 0.88%, is the primary topic of the present study (Figure 3). Thus, the current research paper investigated the disturbances that have occurred in Khorram Abad River’s drainage system and their relationship with the obduction of Khorram Abad’s hidden thrust fault. According to the fact that Khorram Abad Fault is part of a main hidden fault in Zagros strap, justification of its dynamicity for use in the evaluation and prediction of the morphological behavior of Khorram Abad River’s drainage system and even urban planning is of great importance. Thus, the identification of the anomalies that occurred in Khorram Abad River’s drainage system as a result of Khorram Abad hidden thrust fault’s obduction can contribute to the choice of proper measures for counteracting the river’s behavior in future.
Introducing the Study Region
The city of Khorram Abad is located in the structural breadth of Lorestan on the folded Zagros belt in between Khorram Abad’s anticline which is per se situated on the longwall of Khorram Abad hidden thrust fault with a northwest-southeast direction, i.e. parallel to the main direction of Zagros Mountain Ranges. In terms of the geological structure, Khorram Abad’s anticline is a rock structure 15km in width and 70km in length and is envisioned as the relatively large anticlines in this part of high Zagros. The oldest outcropped formation in its core is comprised of Garau and Sarvak carbonate rocks dating back to the Cretaceous period. Younger formations have occurred in an order of their ages in their structural positions. The youngest rock formation of the region includes evaporite marl deposits from Miocene Period, parts of which can be seen only in the northeastern limb of Khorram Abad anticline. Khorram Abad hidden fault has been stretched along Khorram Abad anticline on the southern limb of this anticline (Kamali and Kazemi, 2013) (Figure 2).
The most important river in this region is Khorram Abad River that is considered as one of the distributaries of Karkheh River with a mean annual discharge rate of 10m3/s and an annual yield of 315 cubic meters per year. The river enters Khorram Abad Plain in the Shabikhun Strait section in the northwest of Khorram Abad after taking a 30-km path and passing through the city of Khorram Abad and flowing across Khorram Abad Hidden Fault. Khorram Abad River flows in its route across Khorram Abad anticline and over Khorram Abad Hidden Fault, which is per se located in a northwest-southeastward direction; visibly stretched along the foothills of Yafteh and Sefid Mountains after entering Khorram Abad Plain, the fault is continued for a length of 38km while covered with quaternary sediments of the plain. It eventually passes through the southern section of the city of Khorram Abad.
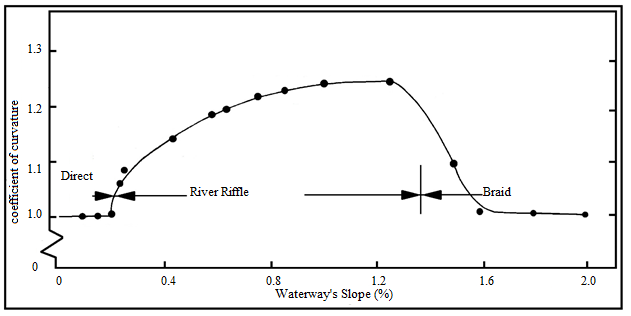
Figure 1: A change in the river’s sinuosity as a result of the change in slope
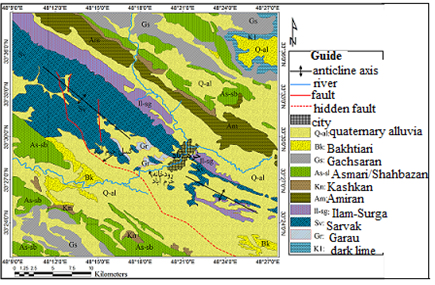
Figure 2: Geology map and path of Khorram Abad River
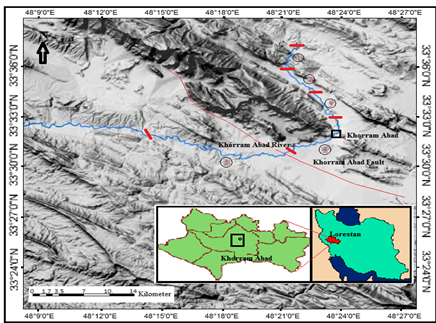
Figure 3: The map of the position of the hidden fault and Khorram Abad River in the study region and the specified zones for the investigation of the morphological properties of Khorram Abad River
To investigate the role of the movements of Khorram Abad hidden thrust fault in the evolution of Khorram Abad River’s drainage system, Khorram Abad River’s route was firstly determined on the geological and topographical maps. Then, based on the infrastructural changes and for investigating the role of tectonic processes on the river’s behavior and morphology, five subareas were determined along the river’s path (Figure 3). The river’s longitudinal or transversal pass through the geological structures, border of the structural changes, change in the hydraulic regime and the tectonic-driven morphological changes were considered as the criteria for selecting the zones.
To investigate the existence and role of the new tectonic movement along Khorram Abad River, the gradient index of the river’s slope, designated as SL, was applied. SL is very sensitive to the changes in the channel and this sensitivity allows having an estimation of the relationship between the tectonic dynamicity and its pace, bedrock’s resistance and its topography (Keller and Pinter, 1996). The high rate of this index is indicative of the regions with high tectonic activity and severe erosive power of the waterways; the lower values indicate regions with low activity. This index is calculated and determined for a given path of drainage network based on the following relation =∆H∆L×L , where ΔH is the elevation difference between two selected spots along the river’s path, ΔL is the horizontal distance between the two spots and L is the length of the entire channel from the selected point to the most elevated part of the channel in the river’s upstream.
In the next stage, the value obtained for the SL index was used to determine the pace of the obduction movements along Khorram Abad River’s path to evaluate the geomorphological effects of these movements for examining the transversal and longitudinal changes in the floor of Khorram Abad River. To do so, the aerial photos from 1955 and Google Earth images from 2016 were utilized.
In doing so, Khorram Abad and the peripheral regions’ scanned aerial photos from 1955 were procured from a geographical organization of the armed forces and subsequently transformed into photographic mosaics in Photoshop and the outputs were inputted into Arc GIS and georeferenced using fixed spots like trees, bridges, and villages. After inputting the satellite images and aerial photos into Arc GIS software, the route of Khorram Abad River was digitized in two temporal spans on these images following which, an AutoCAD output was prepared for the river’s path. After transferring the digital layers of the river path into AutoCAD environment, the amounts of the changes created along the river path were determined in regard of the five zones using the riffle pattern and a circle is tangent to them for the two temporal spans in AutoCAD software and the changes of sinuosity and the number of the meanderings of the river was extracted.
The sinuosity changes in a fluvial system are usually stemming from the recession in the riverbed. Any tectonic metamorphosis changing the slope of the river valley causes a change in the sinuosity of a river at the same level to preserve the balance in the channel’s slope. In proportion to the tectonic changes that lead to the changes in the slope of the river valley, the river’s riffle is also displaced for the preservation of the river slope’s balance (Petrovszki et al, 2014). Sinuosity coefficient is obtained based on the ratio of the channel’s length to the direct distance of the same route according to the relation S=La/Ls, where S is the coefficient of sinuosity, La denotes the river’s length and Ls is the direct length of the valley. The parameter values close to unity indicate active tectonic zones. An increase in the amount of S reflects the reduction in the region’s tectonic activity and signifies the river’s closeness to equilibrium (Petrovszki et al, 2014).
Also, to determine the anomalies along the river path as a result of the tectonic movements, assistance was sought from the longitudinal profile of the river. Longitudinal profiles are powerful instruments for recognizing the mild disturbances that occurred along a river and they show the quality of reflecting the tectonic movements in the longitudinal profile of the river (Radoane et al, 2003). Therefore, to investigate the quality of reflecting tectonic movements, the longitudinal profile of Khorram Abad River was prepared and investigated based on the data of the 10-meter digital elevation model of the region.
The materials presented so far pertain to the outputs of the morphometric calculations on Khorram Abad River. In case that a river is found having reached equilibrium in terms of the agitating and deterring forces, it may begin subduction in the middle of a floodplain for reaching a new balanced profile and create a new floodplain that rising or falling movements occur in a part of its path or its base level falls and/or if other factors disrupt the system’s balance. In this case, the old floodplain becomes a new fluvial terrace. The repetition of this process might create several terraces on top of a river (Merritts et al, 1994; Repka et al, 1997). Thus, the existence of the former alluvial terraces can document the role of the obduction movements of Khorram Abad’s hidden fault.
In line with this, to investigate the alluvial terraces in three downstream and mid-stream regions or mid-anticline region and the upstream side of Khorram Abad River, certain points were selected and visited. The notable point in these spots was the identification and separation of fluvial terraces with various relative ages and their classification and measurement of their relative elevations. To determine their relative age, use was made of tectonic position, the sequence of their placements, sedimentological properties, and stratigraphic relationships. Alluvial channels are sensitive to the slope as well as to the discharge rate and their deposition. Many of the changes that occur over time in the morphology and pattern of the river might be related to the aforementioned changes. As an example, for a given discharge rate, the waterways with low slope, velocity, and deposition load are direct and they become meandering in case that the aforesaid factors are increased; the waterways would be divided into several tributaries in case that the aforesaid factors are largely increased.
Thus, to evaluate the discharge rate’s variations and sedimentation in Khorram Abad River, the discharge rate variations and sedimentation of this river were explored based on the data recorded for a 56-year statistical period, to wit from 1955 to 2011, by Cham Anjir Station situated within a five-kilometer distance in the south of Khorram Abad using Mann-Kendall test, which is one of the most common examinations for the non-parametrical analysis of the hydrological series’ trends. The various studies conducted based on this method have signified the large importance and frequent use of it in the analysis of time series trends. This method is also used for testing the assumption of the randomness of the data sequence versus the assumption of a logical trend’s existence (Azizi and Rowshani, 2008). In this test, Z-statistic larger than 1.96 and 2.58, respectively, indicated a significant trend in 5% and 1% levels. Furthermore, the time series would be in an ascending trend in case of a positive sign for Z-statistic and they would be in a descending trend in case of a negative sign for Z-statistic.
The Gradient Index of the River’s Slope (SL)
The investigation of the SL index indicates that the trend of this index does not continue in a uniform line along the river’s path with an identical slope, rather it changes in various parts of the path. The lowest SL amount in this image belonged to Zone no.2 followed by Zone no.5 and the highest SL amount pertained to Zone no. 4 (Figure 4). The lithographical composition of the river’s bedrock in various segments has been shown in the middle of the diagram. The reduction in SL in Zone nos.2&5 was suggestive of the riverbed’s slope reduction in these segments. According to Figure (4), two primary factors can be enumerated as the causes of such a decrease. The simplest interpretation is the effect of the bed’s non-resistant lithology. As it is seen, the lithological composition of these zones in the entire stretch of the path did not significantly differ. So, lithology couldn`t have much of a great effect. On the other hand, Khorram Abad River is of the alluvial type and the involvement of the riverbed’s lithology in the river’s behavior has been decreased to the lowest possible amount. The second factor is the Zone no.2’s placement in the upstream side of the anticline and hidden Khorram Abad fault’s complex and the placement of the Zone no.5 in the downstream of these two natural reliefs. Anticline’s upheaval in the upstream side of the fault has caused the subsidence or fall-down of the region further down the fault’s downstream, which could justify the low amount of SL in Zone no.5. On the other hand, the elevation of an anticline would be generally accompanied by the deposition in the upstream side of the recession axis. Although sedimentation in this section can increase the river’s entry into the anticline’s axis, leading to the increase in the river’s gradient in the upstream side of the recession axis, the river’s entry would cause an increase in the gradient in the downstream side of the river (Burbank and Anderson, 2012). This effect on the increase in the SL amount can be seen in Zones numbered 3 and 4. The increase in SL amount in Zone no.4 was the result of its placement in the adjacency of the main elevation axis and the increase in this amount in Zone no.3 could be realized a result of the tilting towards the backside of the anticline’s eastern limb over Khorram Abad thrust fault’s wall.
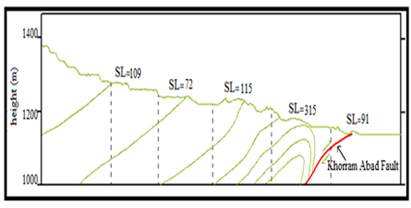
Figure 4: SL amounts for the various zones along the Khorram Abad River
River Riffles and Sinuosity Values of Khorram Abad River’s Various Zones
The lowest and the highest amount of the changes in the number of the riffles in both temporal spans of 1955 and 2015 were respectively belonging to zones number 1 and 5 (Table 1). The low amount of change in the number of riffles in zone no.1 can be ascribed to the bedrock, but the orthogonal movements of this fault would cause an increase in the general slope of the riverbed in zone no.5, which is situated in the adjacency and downstream side of Khorram Abad hidden fault’s recession axis; resultantly, the river would reduce the channel’s slope via creating new waves for reaching a steady state. The reduction in the number of meanders in Zone numbers 3&4 that are situated in the upstream side of the elevation axis can be attributed to two factors: the first is the changes resulting from the elevation of Khorram Abad anticline’s structural complex and the resultant movement in Khorram Abad hidden thrust fault and the second is the human activities including the construction of walls on the riverbanks, dredging and leveling of the riverbed and constructions on the riverbed and riverbank.
Table 1: The number of river riffles in the course of the two temporal spans
|
Zones |
1955 |
2016 |
|
1 |
19 |
18 |
|
3 |
20 |
21 |
|
3 |
18 |
15 |
|
4 |
28 |
26 |
|
5 |
36 |
44 |
The investigation of the sinuosity values in the various breadths of Khorram Abad River for the two-time spans, 1955 and 2015, indicated that the zone no.1 has had the lowest amount during the first period that could have been the result of the river’s limitation to the relatively resistant rock walls. Therefore, in the alluvial section of the river, the zone no.2 had the lowest sinuosity amount; zone nos.3&4 had somewhat high amounts of sinuosity and zone no.5 had the highest amount of sinuosity. The S-amounts obtained for the second period in comparison to the first temporal span showed that the S-value has remained unchanged in zone no.1 and it has undergone a trivial increase in the zone no.2 but S-value was found decreased in zones numbered 3 and 4 and increased in zone no.5 (Figure 5).
The consistency between the changes in the number of meanders, SL variations and sinuosity changes in these areas is expressive of the structural dynamicity. According to Petrovszki (2009), any tectonic metamorphosis that changes the slope of the river’s valley causes changes in the sinuosity of the rivers at the same level, hence the channel’s slope is variegated for preserving balance. Here, as well, the reduction in the sinuosity in the upstream side of the recession axis, i.e. areas 3&4, and its increase in the downstream side of the axis, i.e. vividly in zone 5, can be a response to the changes stemming from the rising of the anticline’s structural complex and Khorram Abad hidden thrust fault.
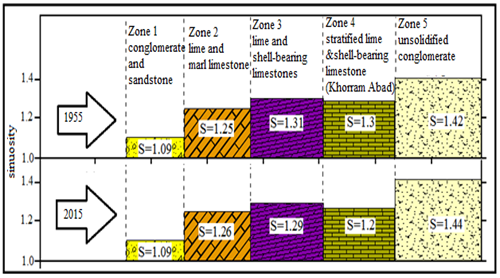
Figure 5: Sinuosity values of various zones in Khorram Abad River
Longitudinal Profile of Khorram Abad River
The longitudinal profile prepared for Khorram Abad River indicated that the riverbed’s profile is generally concave. The state change was abnormally seen in the distance between kilometer 18 and kilometer 29 of the river’s path was expressive of the occurrence of perturbation on the riverbed (Figure 6). This disturbance has somehow caused changes in the shape and dynamic properties of the current in this area. The effect of this disturbance is in such a way that the river’s flow in this region is more turbulent with a velocity more increasingly higher than the downstream and upstream zones for which laminar flows have been documented (Figure 7). The measurements performed on the current’s velocity using the buoyant object in ten stages during summer for each zone are reflective of the idea that the mean measured velocity of the current in the mid-stream region was about 1.6m/s which was significantly and largely different from the velocities recorded for the upstream and downstream zones with values, respectively, equal to 0.8 and 0.56.
The lithological composition of the riverbed did not change in this distance in line with adding to the erosion strength and its reason should be sought in the path’s structural change. Comparing the position of the change with the sinuosity and SL variations, it can be ascribed to the tectonic dynamicity of Khorram Abad anticline and the faults in its periphery in such a way that the outcropping of the anticline’s central part would cause an imbalance in the eroded outcrop’s balance and the riverbed’s profile would be transformed from concave to convex.
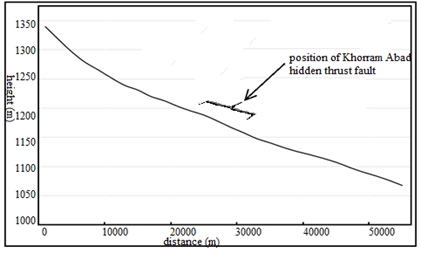
Figure 6: Longitudinal profile of Khorram Abad River
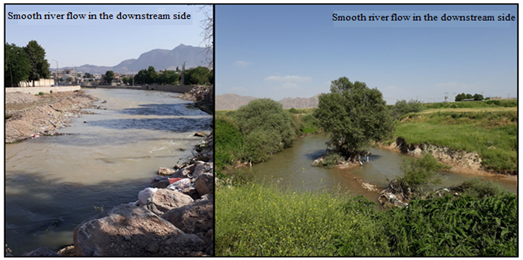
Figure 7: Shape of Khorram Abad River in the downstream and mid-stream sides
Fluvial Terraces in the Periphery of the River
To investigate the alluvial terraces of Khorram Abad River in three regions, namely downstream, mid-stream or inside anticline and upstream sides of Khorram Abad River, certain spots were selected and investigated (Figure 8). To determine the relative age of them, use has been made of the relative age, geomorphological site, placement order, sedimentological properties and stratigraphic relationships between them. In the downstream region, there were identified generally three terrace levels as the old, intermediate and new terraces in the periphery of the river, all of which can be more or less detected in the entire length of the path. The oldest alluvial terrace was found generally comprised of micro-particles scattered in between pebbles and gravels several centimeters in diameter. This section has been completely stuck together by lime cement and situated in the highest level of a 16-meter maximum elevation of the river’s floodplain. The middle terrace’s level has the highest elevation, 11 meters. The majority of the particles are coarse-grained and stuck together by lime cement but have lower relative stability than the old terraces. The surfaces of the new terraces are composed of coarse-grained materials with good mating and without cement. The highest elevation in this level has been measured equal to 3 meters. Figure (8a) illustrates the elevation of the terrace levels measured along Khorram Abad River. To compare the trends of their changes, all three of them have been displayed under numbers 1, 2 and 3. This trend had good consistency in all three levels and indicated the more or less identical behavior of the river over time since the formation of the oldest terrace.
In the middle part of Khorram Abad anticline, the human activities have destroyed the traces of the riverbank. Due to the same reason, the required observations were performed along the path of Karganeh River that enters Khorram Abad anticline from the northeastern side and joins Khorram Abad River in the center of the city of Khorram Abad. The noteworthy point in this region is the increase in the general recession of the terraces. Along Karganeh River, the maximum height of the terraces’ levels reaches 25 meters in some of the spots. But, the notable point in the region’s upstream side is the reduction in the general elevation of the terraces with its maximum height being 20 meters behind the elevation axis in the segment between kilometer 20 and kilometer 30 of Khorram Abad hidden fault that matches with the tilting towards the backside of the anticline. The creation of a terrace along the river’s path is generally a sign of the river’s evolution process on the way to the achievement of a base level. Therefore, the existence of terrace does not in itself indicate the existence of tectonic processes but the difference in the terraces’ heights in the various parts of a river’s channel similar to what is seen on the path of Khorram Abad River can be a testimony to the justification of the tectonic processes. Here, the difference in the height of the terraces in the various parts of Khorram Abad River can be ascribed to the activity of Khorram Abad hidden thrust fault.
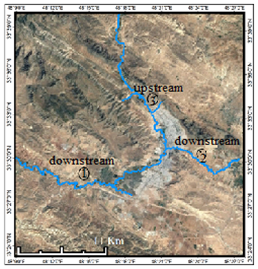
Figure 8: Regions selected for identifying and separating the terraces of Khorram Abad River
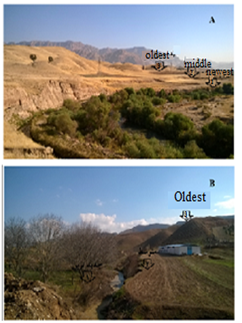
Figure 9: The levels of the measured terraces along Khorram Abad River in the downstream side (A) and mid-stream side (B)
Discharge Rate and Sedimentation Variations
The investigation of the data on discharge and deposition rates of Khorram Abad River in the intended period indicated that the discharge and deposition rates of the river have been descending from 1955 to 2015 as well as from 1971 to 2011 and its intensity has been gradually decreasing in the aforesaid periods. The results related to Mann-Kendall test on the mean values of the annual discharge rates’ data recorded in Cham Anjir Station situated in the southern side of Khorram Abad indicated that two tails of U and U' have been moving nearly parallel to one another and no specific direction change has come about. But, in the second half of the three past decades, the two U and U' tails intersect outside the region, -2.58, and have moved in opposite directions to one another. The results obtained from this test on the mean values of discharge and deposition rates recorded in Cham Anjir Station were expressive of the consistency of these data with the discharge rates of the river. Here, the two tails of U and U' had a descending trend after a stability period in 1990 and intersected one another outside the region, -2.58, and have moved in opposite directions to one another.
This means that the discharge and deposition rates of Khorram Abad River have been descending during the recent three decades (Figure 10).
The scattering and slope of the discharge and deposition rates’ descending trend line for Khorram Abad River have been exhibited based on linear regression in a 99% significance level in Figure 11.
To confirm the current discharge and deposition rates’ variations in Khorram Abad River, Kashkan River that is situated within a 70-kilometer distance to Khorram Abad River and is considered as one of the main distributaries of Karkheh River was selected for comparison. The investigation of the data related to the Mann-Kendall test and linear regression on the mean data of the annual discharge rate in Doab Station, in Visian Zone, indicated that the general trend of the current’s discharge and deposition rates in Kashkan River is closely similar to that of Khorram Abad River. In fact, during the recent 45-year statistical period, the discharge and deposition rates of Kashkan River have been descending like those of Khorram Abad River (Figures 12 and 13). Therefore, it can be stated that the descending trend of the discharge and deposition rates in Khorram Abad River did not stem from the local conditions and that the reduction can be also observed in the rivers in the adjacency of Karkheh River Basin. Therefore, the changes in the deposition and discharge rates of Khorram Abad River cannot be determinants of the variations that have come about in the riffling and number of meanders therein; so, the only known factor responsible for these changes is the tectonic activities.
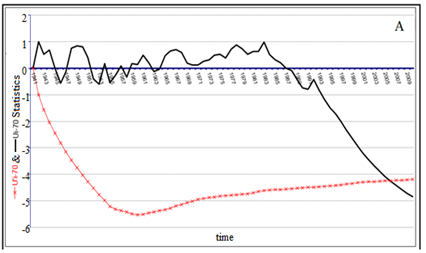
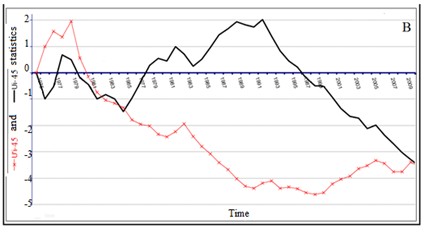
Figure 10: Changes in U and U' indicators of discharge rate (A) and deposition rate (B) for Khorram Abad River
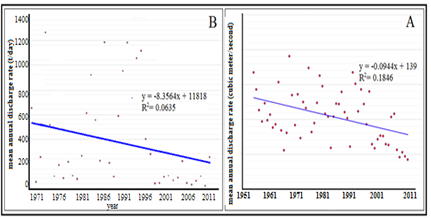
Figure 11: Scattering and regression line after fit estimation based on the data of discharge rate (A) and deposition rate (B) in Khorram Abad River
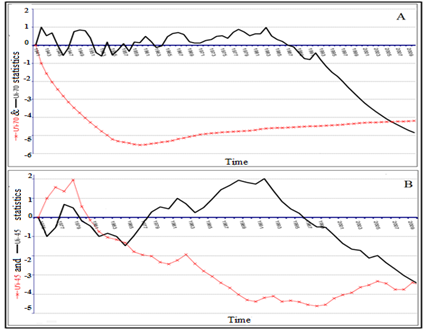
Figure 12: Changes in U and Ui indicators of discharge rate (A) and deposition rate (B) for Khorram Abad River
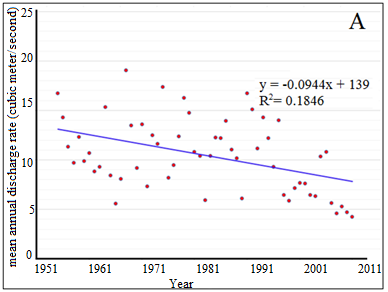
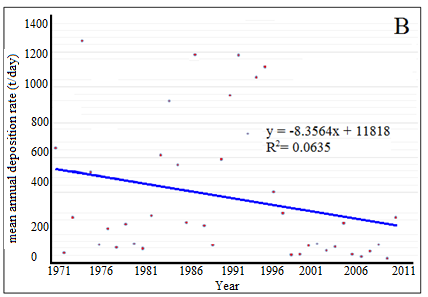
Figure 13: Scattering and regression line after fit estimation based on the data of discharge rate (A) and deposition rate (B) in Khorram Abad River
The increase in SL value in the adjacency of the main recession axis of Khorram Abad hidden thrust fault and the reduction in its value in the fault’s downstream side are suggestive of the idea that the obduction movements of Khorram Abad hidden thrust fault cause upheaval of Khorram Abad anticline and the regions further up the fault’s course and subsidence or abatement of the region down the fault’s path, which has caused an increase in the mean slope along the river’s path. In rivers with slopes ranging between 0.7% and 2%, the slope increase is followed by the increase in the sinuosity of the meanders. According to the idea that the mean slope of Khorram Abad River is about 0.88% at present, the effect of upheaval and increase in the slope along the river’s route would cause an increase in the sinuosity of the meanders and this increase in the sinuosity would be manifested in the form of an increase in the number of the meanders especially in the downstream side of the river. The increase in the slope as a result of Khorram Abad fault’s obduction caused a reduction in the amount of sinuosity in the regions in the adjacency of the main recession axis of the hidden fault in the upstream side and its reduction in the downstream side during the intended period. According to the fact that the S-value’s approaching of unity is a sign of the existence of tectonic obduction, the obtained S-value’s tendency in the adjacency of the hidden fault’s main recession axis in the upstream, specifically zones 3&4, can be expressive of the obduction in this region.
The obduction movements along Khorram Abad hidden thrust fault have caused changes in the longitudinal profile of Khorram Abad River in such a way that the upheaval in the distance between kilometer 15 and kilometer 29 of the river’s path has caused anomalies and vivid disturbances in the river’s longitudinal profile and its transformation from concave to convex.
The relative height differences of the terraces in the various sections of the river indicated the difference in the ascending movements in the region, while three terrace levels with maximum relative heights of 3m, 11m and 16m were observed in the downstream region and the terrace levels had relative heights of 3m, 16m, and 25m in the middle section of the anticline or the place of the main recession axis; the terraces’ levels were 3m, 13m and 20m in height in the mid-stream. This is while the terraces’ relative heights were lower in the upstream regions.
Because the discharge rate of Khorram Abad River has had a fixed or descending trend, the occurred changes that were the results of the long-term morphogenesis process, couldn`t be attributed to the discharge rate’s fluctuations. Also, according to the identicalness of the materials of the riverbed’s sediments, the differences in the various areas were reflective of the idea that the changes cannot be the result of the river’s base level decline. Thus, the primary reason for the morphological changes in Khorram Abad River is the geological movements. So, considering what was mentioned above, the movements of Khorram Abad hidden thrust fault were the most important factor changing the morphology of Khorram Abad River in the studied period
REFERENCES
 This work is licensed under a Creative Commons Attribution 4.0 International License.