32Investigating the Impact of Reservoir Volume Change on Reduction of Electricity Consumption Cost in Gonabad Pumping Stations
Sara Dadar1*, Ebrahim Alamatian2
1Environmental Construction Engineering, Khavaran Higher Education Institute, Mashhad, Iran.
2Assistant Professor, Department of Civil Engineering, Khavaran Institute of Higher Education, Mashhad, Iran.
Abstract
Given the increasing growth of population and community’s need for access to resources, such as water and electricity, optimization and management at all sections of the community are necessary, the present study has sought to develop a program according to which, the existing pumps will be turned on during non-peak hours of electricity consumption and the water stored in reservoirs will be used from 6 pm to 11 pm. For this purpose, minimum costs of use of pumps are calculated by presenting an appropriate solution and providing target function and with the help of a genetic optimization algorithm. To study the effect of changing the volume of the reservoir on the cost of energy, a volume of two thousand cubic meters was added to the previous volume. The obtained results showed that with the change in the volume, about 23% of electricity cost savings was achieved and it amounted to 1,737,000 Riyals on the same day. A pre-requirement for optimization and reduction of energy costs is being familiar with the cost of electricity in each hour of the day. In order to compare the obtained results with the ordinary state, the cost of electricity for 24 hours in an ordinary state should be calculated. Hence, the classification method of energy cost for 24 hours was examined. Then, using the data obtained from Water and Wastewater Organization in the province, the working hours of all the 7 pumps were calculated, and the cost of electricity consumption in the pumping station was examined at 3 ordinary days of the year.
Keywords: Optimization, Pumping Station, Reservoirs volume, Genetic Algorithm
The organizational structure for each potable water reservoir varies depending on the presence or absence of facilities such as pump house, water supply well, green space, disinfection equipment, and maintenance and repair activities. There are various services in utilizing reservoirs that require hydraulic specialties, accurate instrumentation, and structural and maintenance services. With the exception of one or two specialties that are continuous (24 hours a day), the others are according to the required weekly and monthly or seasonal plans. Therefore, continuous specialties should be given greater attention in determination. The main purpose of this study is the efficient use of the pumping station. For this purpose, by estimating the population and per capita consumption and also by calculating the size and dimensions of the reservoirs using a genetic algorithm, the most optimal time schedule for 24 hours of a day is provided. The main purpose of this study is to determine the effect of water volume on the reservoirs considering pump operating hours.
Oliveira and Loucks used a genetic algorithm in order to study and evaluate the rules of operation of multi-reservoir systems. The prominent feature of the genetic algorithm in this area is its freedom in defining and determining operation policies and evaluating them (Oliveira and Loucks, 1997).
Durin et al. in a study, analyzes the changes that occurred in the water consumption regime on the work of reservoirs and their effect on the water supply system. (Durin et al., 2016).
Shemshadi and Veysi, in a study, showed that the capacities and dimensions of water storage tanks in different operating conditions in an actual water pump station have been simulated by dynamic modeling in Simulink/MATLAB software (Shemshadi and Veysi., 2013).
Fu et al. used immune algorithm-based particle swarm optimization (IA-PSO) to represent short-term hydropower scheduling of reservoirs. (Fu et al.,2011).
Bashiri-Atrabi et al., in a study, used a meta-heuristic technique called Harmony Search (HS) algorithm for reservoir operation optimization with respect to flood control (Bashiri-Atrabi et al., 2015).
Hashemi et al. carried out a study on the optimization of dam reservoir utilization by genetic algorithm, considering the probabilities in reservoir inflows (Hashemi et al., 2008).
In 1995, Mackle et al. conducted a research on the optimal use of the cost of electricity consumed by pumping stations. In their research, the genetic algorithm was used as an optimization algorithm (Mackle et al., 1995). The main cost of energy is pumping water to reservoirs. In their research, the amount of electricity consumed by each combined pump has been multiplied by the cost per unit of electricity. Other costs, including maintenance of pumps and switching them on and off, can also be easily included. They showed the evolution of the optimal solution through a genetic algorithm, which includes average population members and the best members of every society. The solution has been achieved after about 10,000 generations. In their example, average population costs are about 5 percent higher than the current optimal solution. If this difference was less, it would be shown by invariability in later generations, and if it was too large, search for efficiency would have more errors. Some of the results obtained by them about optimization for a single reservoir system show that, as expected, the best solution is to use pumps at the low loads time when electricity cost is low. They observed that the reservoir is as full as possible at the low-cost hours and as empty as possible at high-cost hours. If the reservoir was larger, the pumping volume would decrease throughout the day. However, in this case, the most efficient pump (Pump 1), even with high electricity cost, is used almost all day long so that the water level never drops much. Lower efficiency pumps are also used during the night.
According to the latest national divisions carried out in 2005, Gonabad has an area of 9584 km2. Geographically, it is located at 57 degrees and 47 minutes longitude to 59 degrees and 28 minutes in the East and at 34 degrees and 3 minutes latitude to 35 degrees and 52 degrees in the North. Currently, Gonabad is located at Khorasan Razavi Province and it is the Capital City of Gonabad County. The distance from this City to Mashhad City is 270 km and to Tehran is 1091km. Figure (1) shows the satellite images of the area.
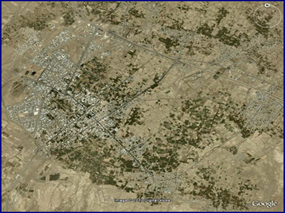
Figure 1: Satellite Image of the City of Gonabad and its Suburbs
In the process of urban water supply, the extracted water from production resources must first be transferred to the reservoirs for storage. Table (1) shows the physical and geographical characteristics of the existing reservoir. Figure (2) also shows the satellite images of the reservoir.
Table 1: Geographical and Physical Characteristics of the Reservoir in Gonabad City (Khorasan Razavi Water and Wastewater Organization, 2016)
|
Place of Establishment |
UTM |
Height (m) |
Type of Reservoir |
Function |
Reservoir Volume (m3) |
Reservoir Material |
Chlorination System |
Yard |
|
Twin Reservoir |
653345 300230 |
1128 |
Ground Reservoir |
Storage |
10000 |
Concrete |
Yes |
Yes |
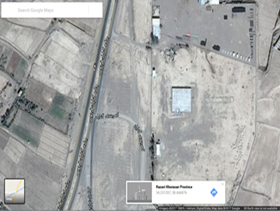
Figure 2: Satellite Image of Gonabad city reservoir
Outflow discharge values of the reservoir in 2016-2017 are available. With the help of raw data obtained from the Water and Wastewater Organization of the City of Gonabad, outflow discharge chart for 24 hours of a day for each month has been shown in Figure (3).

Figure 3: Average outflow discharge per 24 hours of a day (Khorasan Razavi Water and Wastewater Organization, 2016)
According to Figure (3), the highest water consumption in the region is related to the first half of the year and the months of June and August. The reason why in July, despite warmer weather, the outflow discharge is lower than the previous month maybe because of the holy month of Ramadan was in July that year. Figure (4) shows the outflow discharge value for 24 hours a day on May 29, 2017; Figure (5) shows outflow discharge value on January 27, 2017; and Figure (6) shows outflow discharge value on October 29, 2016.
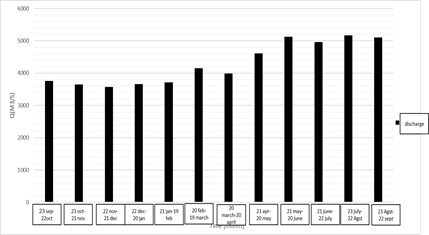
Figure 4: Changes in the outflow discharge of the reservoir to the network on May 29, 2017 (Khorasan Razavi Water and Wastewater Organization, 2016).
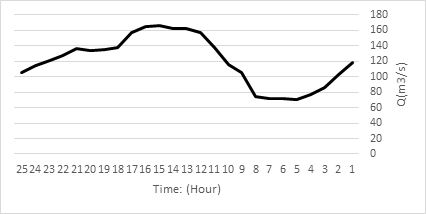
Figure 5: Changes in the outflow discharge of the reservoir to the network on January 27, 2017 (Khorasan Razavi Water and Wastewater Organization, 2016).
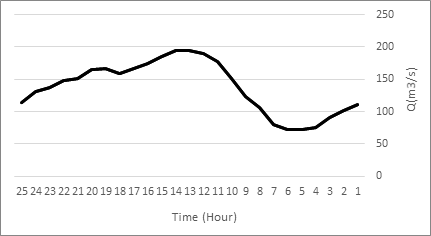
Figure 6: Changes in the outflow discharge of the reservoir to the network on October 29, 2016 (Khorasan Razavi Water and Wastewater Organization, 2016).
As shown in Figure (4), it is observed that on this day, the consumption discharge is reduced from the early hours of the day and the discharge is increased at 7 am to 8 am when the general public wakes up; and at 7 pm to 10 pm, consumption discharge reaches its peak. It is also seen in Figure (5) that on this day, the maximum discharge is from 3 pm to 4 pm, which is equivalent to 166.55 m3/s. The lowest discharge is also from 5 am to 7 am and is equivalent to 70.34 m3/s. As shown in Figure (6), the maximum discharge on October 29 is from 12 pm to 1 pm and the lowest discharge is at 4 am and is equal to 72.2.
Kheibari Station has 7 electro-pumps. The specifications and types of pumps have been presented in Table (2).
Table 2: Specifications of pumps in Kheibari pumping station of the City of Gonabad (Khorasan Razavi Water and Wastewater Organization, 2015)
|
Specifications |
Current Electro-pump |
Contract Demand |
Read Demand |
Static Pressure (bar) |
Dynamic Pressure (bar) |
Line Discharge (l/s) |
Panel Type |
|
Type |
|||||||
|
Kheibari Pumping |
100.5 |
350 |
318 |
6.5 |
8.5 |
85 |
Stars Triangle |
|
150.3 |
Stars Triangle |
||||||
|
150.3 |
Stars Triangle |
||||||
|
100.5 |
7 |
9.5 |
112 |
Soft |
|||
|
100.5 |
Soft |
||||||
|
100.5 |
Soft |
||||||
|
100.6 |
Remote Control |
It can be seen that there are 7 pumps at this station, all of which are of high-pressure type and are manufactured by Pumpiran Company. This station has, in total, 3 types of pumps that specification curves of each type can be seen in Figures (7), (8) and (9). There is no reservation pump at this station and the operator switches the pumps on and off voluntarily according to the desired discharge and water level in the pumps’ reservoir.
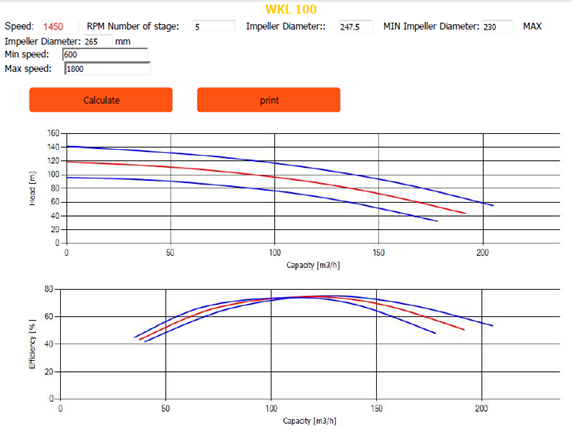
Figure 7: Specification curves of type 100.5 pump (Pumpiran, 2016)
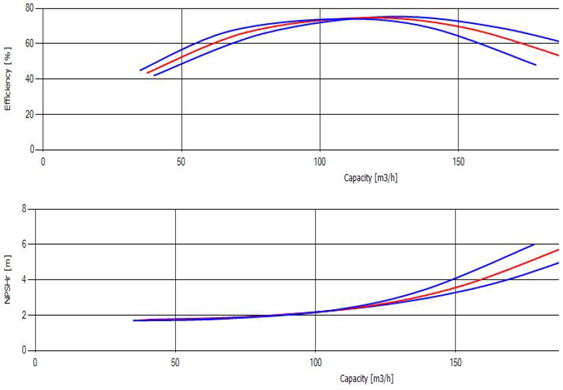
Figure 8: Specification curves of type 100.6 pump (Pumpiran, 2016)

Figure 9: Specification curves of type 100.6 pump (Pumpiran, 2016)
Generally, for 24 hours a day, power consumption is divided into three sections of low consumption, medium consumption, and peak consumption. Table (3) shows the divisions of hours and costs of each.
Table 3: Power consumption price at the pumping station in 2015 (Ministry of Energy, 2015)
|
Low Consumption |
Peak Consumption |
Medium Consumption |
|
|
7-23 |
19-23 |
7-19 |
First 6 months of the year |
|
6-22 |
18-22 |
6-18 |
Second 6 months of the year |
|
106.5 |
426 |
213 |
Price per 1 KWH (Riyal) at 2015 |
Accordingly, the pumps operating hours per month are based on 3 divisions and can be seen in Figure (10). Also, Figure (11) shows the total sum of low consumption, medium consumption and peak consumption from October 2016 to September 2017. According to Figure (10), the cost of electricity in summer was higher than the other seasons due to the energy consumption of pumps which can be attributed to warm weather and high demand for water. Moreover, as seen shown in Figure (11), the highest cost of electricity consumption is during medium consumption hours (from 7 am to 7 pm).
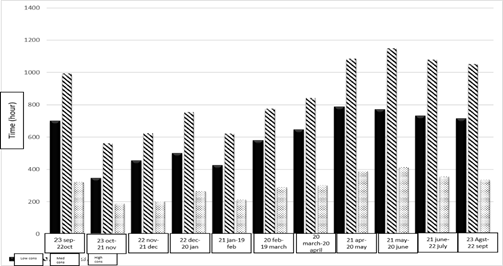
Figure 10: Hours of pumps operation at low consumption, medium consumption and high consumption hours in each month (Khorasan Razavi Water and Wastewater Organization, 2016)
Figure (11) also shows the total operating hours of pumps at low consumption, medium consumption, and high consumption hours from October 2016 to September 2017. According to this figure, it can be seen that the total pump operation during a year is at its highest value on medium consumption hours.
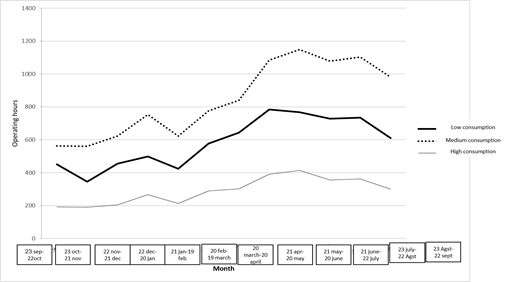
Figure 11: Total operating hours of low consumption, medium consumption, and high consumption hours from October 2016 to September 2017 (Khorasan Razavi Water and Wastewater Organization, 2016)
Genetic Algorithm (GA) is a computer science search technique for finding an approximate solution for optimization and searching problems. Genetic Algorithm is a special type of evolutionary algorithms that uses evolutionary biology techniques such as inheritance and mutation (Abbasikia, 2013). Genetic Algorithm is used in hydrological routing problems of runoff flowing in dry river network, helping to solve multi-criteria decision-making problems, multi-objective optimization in water resource management, as well as optimization and rearrangement of power distribution networks.
The precondition for finishing the plan is as below:
There are different methods for the calculation of the volume of storage reservoirs. One of the common methods is a calculation based on the size of the city. In this method, the capacity of the reservoirs is usually considered to be between 50% and 70% of maximum daily consumption.
Another method for the calculation of the volume of storage reservoirs is based on the three following parameters:
Determining the volume of storage that the city needs for the next 10 to 20 years will be the basis for calculation, and predicting the city’s development in the next 50 years is taken into account.
Table 4: Estimation of Gonabad City storage volume until 2036
|
Year |
Storage Volume for Time Fluctuations (m3) |
Storage Volume for Firefighting (m3) |
Storage Volume Needed for Power Outages (m3) |
Total storage volume (m3) |
Available Storage Volume (m3) |
The deficit in Storage Reservoirs (m3) |
|
2006 |
3,111.7 |
432.0 |
7,779.3 |
11,323.1 |
10,000.0 |
1,323.1 |
|
2011 |
3,678.5 |
432.0 |
9,196.3 |
13,306.8 |
10,000.0 |
3,306.8 |
|
2016 |
4,025.2 |
432.0 |
10,063.1 |
14,520.3 |
10,000.0 |
4,520.3 |
|
2021 |
4,512.3 |
432.0 |
11,280.7 |
16,225.0 |
10,000.0 |
6,225.0 |
|
2026 |
4,911.0 |
432.0 |
12,277.6 |
17,620.6 |
10,000.0 |
7,620.6 |
|
2031 |
5,357.9 |
432.0 |
13,394.6 |
19,184.5 |
10,000.0 |
9,184.5 |
|
2036 |
5,795.3 |
432.0 |
14,488.3 |
20,715.6 |
10.000.0 |
10,715.6 |
The Effect of Volume Change on Costs of Pumping Station
In this section, the purpose is to estimate the changes achieved in the reservoir. For this purpose, another volume of 2,000 cubic meters was added to the 10,000 cubic meters. By applying this volume on a day like May 29, 2017, the cost of energy by the genetic algorithm was reduced from 2,280,000 Riyals to 1,737,000 Riyals which is equal to 23 percent cost reduction (Figure [12]). Figures (13) to (19) show the pumped discharge of each pump during 24 hours of the day on May 29, 2017.
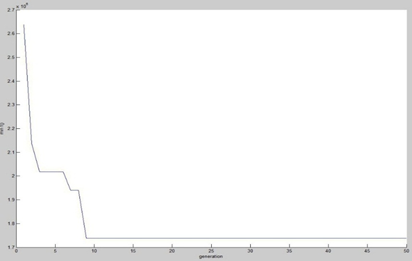
Figure 12: The Cost Obtained From Software Output after 50 Generations
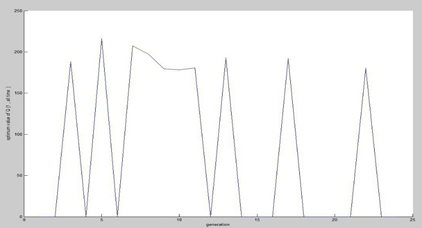
Figure 13: Pumped discharge from pump 1 on May 29, 2017
As can be seen in Figure (13), pump number 1 has pumped the highest discharge at 5 am. This pump had been switched off on May 29 for 13 hours, four hours of which had been on peak consumption time.
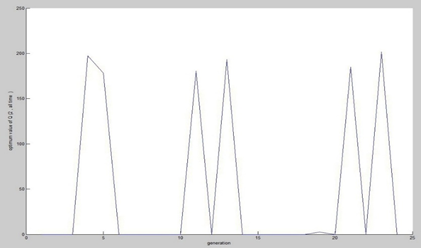
Figure 14: Pumped discharge from pump number 2 on May 29, 2017
It can be seen in Figure (14) that the maximum pumped discharge from pump 2 is at 11 pm. This pump has also been switched off for 15 hours on this day.
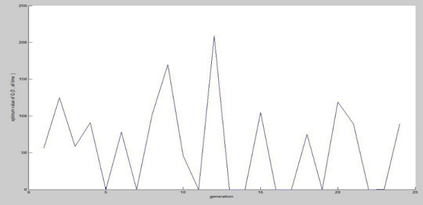
Figure 15: Pumped discharge from pump number 3 on May 29, 2017
According to Figure (15), the highest use of pump number 3 had been at 12 pm. This pump had been switched off for 10 hours on May 29.
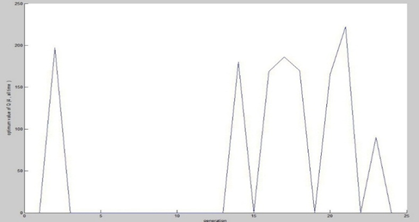
Figure 16: Pumped discharge from pump number 4 on May 29, 2017
According to Figure (16), pump 4 has pumped the highest discharge at 9 pm. This pump has been switched off for a total of 16 hours on this day.
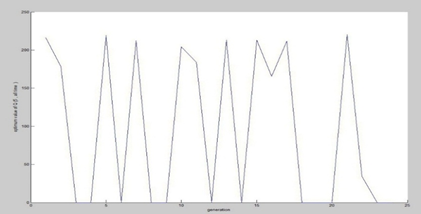
Figure 17: Pumped discharge from pump number 5 on May 29, 2017
The pump 5, according to Figure (17), had been switched off during May 29, 2017, for 11 hours. The average pump discharge by this pump is 106 m3/s.
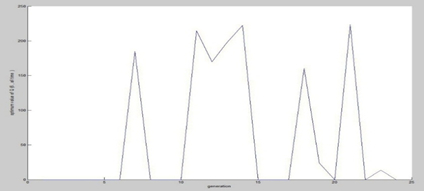
Figure 18: Pumped discharge from pump number 6 on May 29, 2017
As shown in Figure (18), pump number 6 had been switched off for 15 hours on May 29. The maximum pump discharge by this pump is at 9 pm.
Figure 19: Pumped discharge from pump number 7 on May 29, 2017
As seen in Figure (19), pump number 7 had been switched off only for 8 hours on this day. The highest use of this pump is at 7 pm. This pump is mostly used during peak consumption hours.
In this study, firstly, the studied city and its current and future population were examined. Per capita consumption and water demand were also estimated. Then, the statistics and data obtained from the Water and Wastewater Organization of the province including the location and specifications of the reservoir, outflow discharge during the year, type and specifications of the pumps were examined. As seen in the explanation above, there were no specific instructions for operation of pumps at many pumping stations, and the operator, depending on the need and conditions of available water in the reservoirs, and without paying attention to the low consumption or high consumption hours of the day, switches the pumps on and off. This kind of operation imposes a lot of costs on the system. Considering the high cost of electricity for water supply networks and also given the lack of natural resources, it is important to investigate this issue, because optimization of the volume of water storage reservoirs and presentation of the operation plan of pumping stations can greatly help national funds by savings and optimization. In this study, due to the existing limitations, the guidelines for station pump operation and they're being switched on and off were presented such that operation cost will be minimized. At the end, we answered the main research question; whether the cost of consumed electricity can be reduced by changing the volume of reservoirs? In response to this question, it can be said that increasing the volume of reservoirs, given the increasing trend of the population of Gonabad city and the fact that the pumps have high discharge capacity, has a positive effect on reducing costs, such that by applying 2,000 cubic meters of volume, about 23% energy cost savings were achieved.
REFERENCES
 This work is licensed under a Creative Commons Attribution 4.0 International License.