The present work is dedicated to presenting the influence of climatic factors on floods, among the more serious cases known for the region, the floods of October 2008 were caused by heavy rainfall with a height of 108.40 mm. In addition, we are interested in the physical parameters such as the sections and the slope of the valley Béchar, which is at the origin of the disaster. The profile along the valley shows a slope steeper that causes the acceleration of the flow, the calculation of the sections of the valley's various points also reveals the variations at the slope level, which sub-tends to the bad behavior of the water flow at the level of the section reduced. Although it is so, these investigations have guided and alerted us once more on the need for a development-integrated space taking account of regional specificities.
INTRODUCTION
Floods are a major risk in the contemporary world. They are contained in the first rank of natural disasters in the world, causing approximately 20.000 victims per year (Simona & Cedric, 2007).
Algeria submitted to the floods that occur catastrophically thus constituting a major constraint for economic and social development, including the more deadly those of the last decade, such: as Ghardaïa (2008), Adrar (October 2004 and January 2009), Béchar (2008/2014),) Sidi Bel Abbots (April 2007), Bab El Oued.
The catastrophic floods that have confronted the city of Béchar (southwest) are always related to the flooding of the Valley of Béchar (October 2008 ; Xuan et al., 2022) following the rainfall during the days. A tire indicative, in October 2008 the precipitation reached more than 108mm, this is unusual for the region of Béchar and has been a determining factor in the overflow of the Valley of Béchar, the present work is reserved for highlighting the impact of the factors which have caused the process of the phenomenon of the Flood:
MATERIALS AND METHODS
Geographical characteristics and morphometrics of the region
Located in the southwest of Algeria, this basin is part of the Great Basin of the Saoura. It is understood between the Latitude 31°47'30.55" north and longitude 1°49'4.04" West, on a surface of approximately 6122 km2 and a perimeter of 698 km, oriented to the north (upstream) where it takes its source toward 1959 m of altitude in the Djebel Grouz South (downstream) to 501 or he is going to lose in the Dayet Tiour, it is located at the foot of the southern slope of the Saharan Atlas, limited to the north by the mountainous chain Djebel Grouz, South is by the Great Western Erg, to the west by the Hamada of Guir and to the east by the Hamada Valley of Namous, this basin drains by the Valley of Béchar with a length of the main watercourse (Valley of Béchar) of 166 km, the Average slope of the Valley up to Dayet Tiour is approximately 6%.
During the passage of the Valley toward their outfall, crossing the city of Béchar in the middle along 20 km, and due to the high slope observed in this segment, adding the change of the section of the Valley who contract and reduced in this passage, produces an overflow of flow of waters in the vicinity of the neighboring districts of a bed of the Valley.
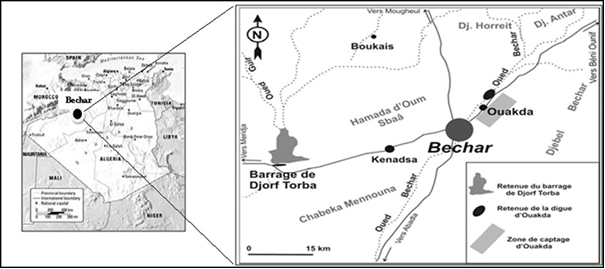
The geographical situation of the city of Béchar (southwestern Algeria) is provided in Figure 1.
|
|
|
Figure 1. Geographical situation of the city of Béchar (southwestern Algeria) |
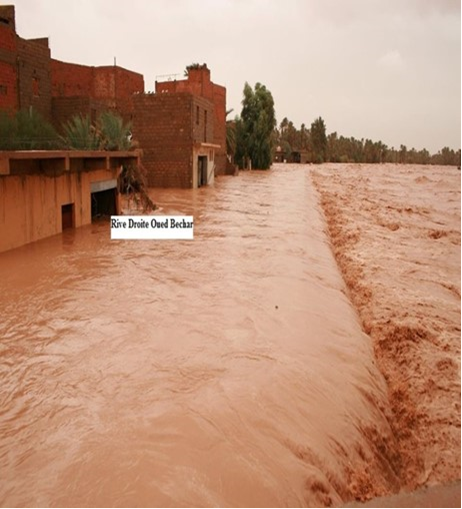
The flood of October 2008
The City of Béchar (southwest) was known for the catastrophic flooding associated with the Béchar Valley flood in October 2008, with rainfall occurring over days resulting in the overflow of the Béchar Valley (Figure 2). Table 1 represents the interventions of civil protection to the damage of this flood.
|
|
|
Figure 2. The flood of October 2008 (homes flooded) |
Table 1. The result of the interventions of the Civil Protection (Directorate of Civil Protection of Béchar, 2008)
|
Type of Intervention |
Total collapse |
Partial collapse |
Partial collapse of Establishment |
Suction of Housing water |
Saved People |
Drowning |
Saved Truck Vehicle Bus |
Death |
|
2008 Flood |
26 |
145 |
18 |
235 |
70 |
08 |
09 |
00 |
The City of Béchar is located in an arid zone, which is characterized by the weakness of the precipitation, Concerning the risk of flooding, it is subject to violent and intermittent floods related to precipitation that frequently occur between October and March. Among the factors favoring the overflow of the Valley of Béchar, we have:
The climatic parameters
The watershed of Béchar characterized by a scarcity of rainfall stations for a long time up to these days, Within this basin there are two stations; the station of the National Meteorology Office and the station of the National Agency of Water Resources which are insufficient to study an element to high variance as the precipitation.
The data used in this work have been collected from the train station, which NOM (National Office of the Meteorology of Béchar, 2014) is surrounded in the watershed of the Valley of Béchar, The data available for the study are climatological (1993/1994-2009/2010) where he uses the annual values and monthly.
The variations of precipitation during the 'Hydrological years seem to be a fluctuation and alternation in rainfall, with the interannual averages (141,33 mm).
The watershed of the Valley of Béchar is located in an arid zone, this last characterized by a weakness of annual precipitation as shown in the table previously.
RESULTS AND DISCUSSION
The profile in the length of the valley of Béchar
From the Profile in the length of the Valley of Béchar, we can show a change in the slope, The latter contains several parts, a first where it is slightly important, there is a decline of approximately 20 m, which is spread over a length of 08 km, the second part characterized by an alternation of the slope between stabilities, Increase and Low, that promote the stagnations of waters, in this part we note a decline of 15 m along 8 km, by against the third part is characterized by a decline of 35 m on a length of approximately 08 km.
On the other hand from the profile in long, it can be noted the changes that affect the latter, where it shows several states. In its upstream part, the profile indicates a significant slope, it allows a flow of water toward the central area of the city. By against is in this last part where the profile takes a form of right almost straight, thus favoring the floods, In the last state the profile shows a slight slope straight sometimes also to foster floods.
The sections of the Valley of Béchar change from one point to another, which generates a behavior specific to this course of water. This calculated the sections and their spatial variations are indispensable.
The climatic
Basic Statistics of precipitation of the station of Béchar are presented in Table 2.
Monthly distribution of precipitation
The variation of the pluviométries monthly averages highlights that the rainiest months during the hydrologic year are September, October (flood 2008), November (flood 2014), March, and May, the months of June, July, and August are virtually dry.
The annual precipitation and its variability
The variations of precipitation interannual seem to a fluctuation and alternation in rainfall around the interannual average, the interannual average is (141,33 mm), the years (1993, 1994, 1996, 2002, 2006, 2007, 2008, 2009), which are the most rainy with a maximum of 324,01 mm (2008), it is observed that the years (1995, 1997, 1998, 2000, 2001, 2003, 2004, 2005, 2010) are the driest years and year infertile in the series is 1999 (10.84 mm).
Table 2. Basic Statistics of precipitation of the station of Béchar.
|
Station of Béchar |
Statistical parameters |
||||||
|
Years of observation |
Average (mm) |
Max (mm) |
Min (mm) |
Standard deviation (mm) |
Coefficient of variation |
Coefficient of skewness |
|
|
18 |
141,33 |
324,01 |
10,84 |
94,971 |
0,672 |
0,676 |
|
Coefficient monthly rainfall
It is a concept very expressive. The coefficients greater than 1 correspond to the months receiving more than their share of rain; those less than 1 to the contrary case; we distinguish at first sight the months "wet" (or "wet") and months "dry" (by agreeing to call wet, or rainy weather, and dry the months which have received more or less than their share) (Musset, 1935; Rohmani et al., 2022).
The previous study shows the month of September. In October. In November. March and May, are considered rainy. The month of October is characterized by a coefficient maximum rainfall (1,86), which is greater than the threshold value 1, which allows us to consider it as the wettest month, the study below shows that precipitation reaches the values in the arid zones in October.
Number of rainy days
In our study, the histogram of variation of the number of days of rain shows that the maximum value of these days of rain is recorded in the fall season precisely in September and October, which is the period of flooding (year Flood 2008; Maghami et al., 2022), these are the rainiest months, the months of the summer season are driest dry in its monthly averages.
Variation of seasonal pluviométries
To note also as regards the seasons of Winter and spring, which are considered as wet seasons due to the quantity of rain recorded in them, which vary with the other alternately everything depends on the quantity registered in each season.
Summer is the most sec among the seasons of the year because of the low quantity of rain recorded in it.
Study of the temperature
The temperature of the area acts directly with the other meteorological factors (precipitation, evapotranspiration, insolation, runoff, infiltration, etc.), it is a factor important climate which affects the balance sheet and the climate of a region.
The interannual average temperatures of the coldest year are recorded in 1993 (2 1.27 °C.), whereas the warmest year is 2010 (23.50 °C.)
For our study, we used the data in minimum temperatures, maximum, and medium of the station of Béchar.
Average Variation Interannual temperature
The curve of interannual variation of temperatures represents an increasing variability which reached a maximum (23.50 °C) in the year 2010 and a minimum registered in the year 1993 (2 1.27 °C), this increase of the successive temperatures resulted in climate change.
Variation of monthly temperatures
Our region is characterized by a hot summer where high maximum temperatures can exceed 41°C in July, and a relatively cold winter with temperatures of the coldest month recorded in January (09,72 °C), an average temperature interannual of 22.36 °C.
Studies of evaporation
Evaporation is the refund of water to the atmosphere in the form of steam from the surface of the ground, regardless of its nature (soil, plant, or water-free). It is, therefore, a very important element for the establishment of the hydrological balance, Evaporation is influenced by solar radiation, the temperature of the air and the water, relative humidity of the air, wind speed, and the quality of water.
The evaporation affects all the masses of water. Flow of water molecules that have sufficient energy to vaporize and join the atmosphere since a water surface. These molecules saturate the air immediately above. The difference air saturated -and dry air from above affects the flow of water vapor (mm/day mm/month or mm/year).
Since 1950, several formulas have been developed to estimate evapotranspiration: Thornthwaite (1944), Turc (1962), Blanney-Criddle (1950), and Penman- Monteith-FAO (1998).
The use of these models requires the knowledge of certain climate data such as maximum and minimum temperatures of the air, the relative humidities maximum and minimum, the global solar radiation, and wind speed (Habaieb & Masmoudi‐Charfi, 2003).
The potential evapotranspiration ETP
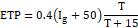
Method of Thornthwaite (1944)
The formula from Thornthwaite is used when only the temperature is the only climate data. It expresses the potential evapotranspiration (ETP) by the following formula (Agoussine et al., 2004):
|
|
(1) |
|
|
(2) |
|
|
(3) |
|
|
(4) |
With
I: the sum of 12 monthly indices of the year, T: mean monthly temperature (°C), and ETP: potential evapotranspiration (mm).
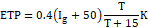
Formula of Turc (1962) (Bouchet, 1963)
This method involves the monthly mean temperature, the overall radiation of the month considered, and the insolation relative. In this case, the ETP is expressed in mm/month according to the following formulas:
If RH (The relative humidity) > 50%, It was:
|
|
(5) |
If RH (The relative humidity) is < 50% (Generally the case under our climates). It is:
|
|
(6) |
|
|
(7) |
|
|
(8) |
With
ETP: Potential evapotranspiration monthly (in mm of water);
T: mean monthly temperature of the air (in °C);
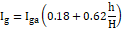
Ig: overall radiation monthly average received on the ground (calorie/cm2/day);
K: coefficient equal to 1 if the relative humidity RH is higher than 50%. The more air is hot the more it can contain water vapor (or humidity) (generally the case under our climates);
Iga: radiation Theoretical overall for the month considers, that depends on the latitude, obtained has partiras table (source: N.O.M. Béchar) (in cal/cm2/day).
H: The lasts an average of insolation in time.
H: Astronomical lasts the day in time, depends on the latitude, and is obtained from the tables the coefficient 0.4 is valid for me s of 30 to 31 days for February will replace 0.4 by 0.37.
The values of ETP found by this formula should be corrected by a factor of corrections K ETP corrected = ETP.k.
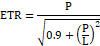
The actual evapotranspiration ETR
The actual evapotranspiration is the amount of water evaporated or transpired by the soil, plants, and the free surfaces of a watershed, it is expressed in millimeters.
Formula of Turc
This method applies to all climates and it is a function of precipitation and average monthly temperatures. The formula is the following:
|
|
(9) |
With
ETR: evapotranspiration Annual Actual in mm.
P: Precipitation annual average, in mm;
T: Annual average temperature. L=300+25T+0,05T3.
The indices' general climate
Index of aridity of Martonne (Iar)
In 1926 Emmanuel de Martonne proposed a formula allowing climatological calculation of an index said aridity index (Iar). This index requires Knowing the height of the average precipitation interannual and the average Temperature Interannual Prediction (De Martonne, 1926).
|
|
(10) |
With:
P: Average precipitation interannual in mm.
T: The average Temperature Interannual in °C.
Table 3. Parameters of the calculation of an index of aridity (Iar).
|
Station of Béchar |
P (mm) |
T (°C) |
Iar |
|
141,33 |
23,50 |
4,21 |
For the station in Béchar, the index is equal to have = 4,21, and less than five (i < 5), which allows you to say that the climate of the area of study is hyperarid (Table 3).
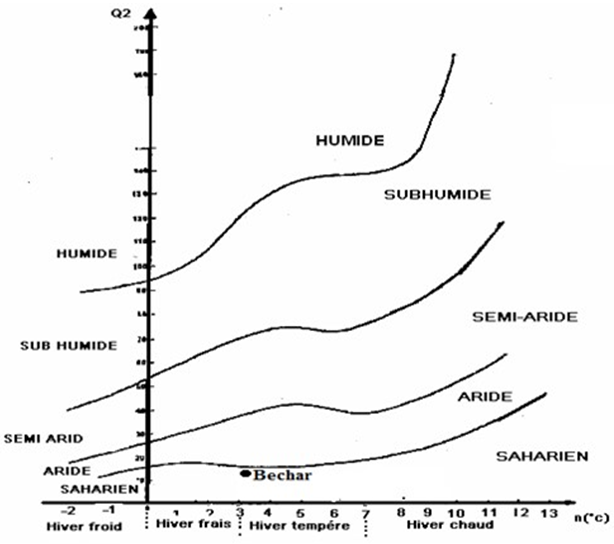
The diagram of the Emberger (Climagramme of Emberger)
Climagramme of Emberger is the classification the most often used to specify the climate of the region, where Emberger has sought a synthetic expression of the Mediterranean climate able to account for the drought, on which we have postponed the data relating to the station of Béchar in the abscissa the average temperature of the minima of the coldest month (in °C), and ordered Q2 given by the following formula:
|
|
(11) |
With:
Q2: The quotient of rainfall in L. Emberger
P: The precipitation interannual average in mm.
M: The average of the temperatures maxima of the warmest month in (°K)
m: the average of the minimum temperatures of the coldest month in (°K).
|
T (°K) = T (°C) + 273 ,15 |
(12) |
Table 4. Parameters of the calculation of an index of aridity (Iar).
|
Station of Béchar |
P (mm) |
M |
m |
Q2 |
||
|
°C |
°K |
°C |
°K |
|||
|
141,33 |
41,23 |
314,38 |
3,25 |
276,40 |
12,59 |
|
|
|
|
Figure 3. Climagramme of the Emberger |
According to the values in Table 4, we have postponed the data relating to the quotient of rainfall and the temperature of the minima (3.25; 12,59), The Climagramme of the Emberger (Figure 3), allows you to say that the study area has a climate Saharian with winter tempers.
CONCLUSION
The study area is part of the great watershed of Saoura, It is characterized by a climate Saharian arid with a cold winter and a hot summer and dry.
Examination of the series of precipitation for the period (1993-2010) revealed an average rainfall of 141,33 mm for the watershed of the Valley of Béchar. The examination of the precipitation and temperatures of different positions in rainfall has given specific results for the watershed of the Valley of Bécharwith:
In this study we have put in evidence that among the factors that direct the phenomenon of flooding the climate factor takes the large hand, The area of study is an arid zone characterized by large precipitation recorded in the fall season where the city of Béchar subject to flooding which occurs catastrophically thus constituting a major constraint for the economic and social development, these floods which have become the challenges of environment the most serious problems are facing urban communities and imports their size, once the risk situation is described; it is possible to make a forecast of a wide range of facilities which may a priori to participate in the reduction of the consequences of the Flows causing floods, Among the facilities can be provided for in the primary networks and the major bed of water courses.
Reduction of the hazard
The purpose of the reduction of the hazard is to reduce waters in the areas with strong human issues and economic to the scale of the watershed:
Reduction of vulnerability
ACKNOWLEDGMENTS: None
CONFLICT OF INTEREST: None
FINANCIAL SUPPORT: None
ETHICS STATEMENT: None
Agoussine, M., Saidi, M. E., & Igmoullan, B. (2004). Reconnaissance des ressources en eau du bassin d’Ouarzazate (Sud-Est marocain). Bulletin de l’Institut Scientifique, Rabat, section Sciences de la Terre, 26, 81-92.
Bouchet, R. J. (1963). Evapotranspiration reelle, evapotranspiration potentielle, et production agricole. Annales agronomiques, 14, 743-824.
De Martonne, E. (1926). Aresime et indice d'aritile. ComptesRendus de L’AcadSci, 182, 1395-1398.
Directorate of Civil Protection of Béchar. (2008). Office of natural risks, report of flooding.
Habaieb, H., & Masmoudi‐Charfi, C. (2003). Calcul des besoins en eau des principales cultures exploitées au nord de la Tunisie: Estimation de l ‘évapotranspiration de référence par différentes formules empiriques (cas des régions de Tunis, Béja et Bizerte). Science et changements planétaires/Sécheresse, 14(4), 257-265.
Maghami, H., Parhizkar, H., Riasaty, A., Banani, A., Poustfroosh, M., & Hasehmpour-Sadeghian, M. (2022). Identifying the parenting style of students’ parents of an school at Shiraz University of medical sciences. Journal of Advanced Pharmacy Education and Research, 12(1), 91-96.
Musset, R. (1935). The calculations relating to the rainfall regimes. Rainfall fraction, gap relative rainfall, rainfall coefficient relative. The Studies Rhodaniennes, 11(1), 75-85.
National Office of the Meteorology of Béchar. (2014). The data in precipitation of the station of Béchar. Period 1993/1994–2009/2010.
Rohmani, S., Desi, B. A., & Wardhani, W. D. (2022). Potassium-Azeloyl-Diglycinate BB-Cream formulation with Triethanolamine variation, and its effects on In-Vitro SPF stability and values. Journal of Advanced Pharmacy Education and Research, 12(1), 1-8.
Simona, N., & Cedric, L. (2007). Sustainable management of flood-prone areas in the Danube Delta (Roumanie). In: 1res Science Days Inter'reseaux of the AUF, integrated management of water and soil. The resources, facilities and risks in rural and urban environments, 6-9 November 2007, Hanoi, Vietnam, 02 p.
Xuan, E. Y. H., Razak, N. F. A., Ali, A. M., & Said, M. M. (2022). Evaluation of knowledge, attitudes, and perceptions on halal pharmaceuticals among pharmacy students from Malaysian private universities. Journal of Advanced Pharmacy Education and Research, 12(1), 84-90.
 This work is licensed under a Creative Commons Attribution 4.0 International License.