The erratic weather pattern in recent years pose a great threat to human survival and livelihood in Sierra Leone. The rationale for this study was to determine rainfall variability and drought frequency occurrence in Sierra Leone from 1990-2020. The daily precipitation data were accumulated to obtain the monthly and annual precipitation extending over 30 years × 12 months × 2383 cell grids. Three metrics were used to determine drought and rainfall changes; Standard Precipitation Index (SPI), Drought Severity (DS) and Drought Intensity (DI). About eight SPI scales namely; (SPI-1, SPI-3, SPI-6, SPI-9, SPI-12, SPI-18, SPI-24, SPI-48) time series were computed. All statistical evaluations and visualizations were carried out using R Studio, version 4.0.3 (R Core Team, 2020). The highest annual rainfall ranges from 1000-4700mm with the west being the wettest region in Sierra Leone. The results showed that annual rainfall is less in the northeast as compared to the west and southern part of the country. A significant decline in precipitation was observed in 2009, 2003, 2004, 2005 and 2015 respectively. While 1992, 1993, 1994, 1995, 1996, 1997, 2008, 2010 and 2011 were observed as the wettest years. The study reveals that, drought incidence decreases contrariwise while duration linearly increases base on time scale. Drought characteristics and vulnerability risk differ across regions and was eminent across the northern province. The findings of this research can be enhance to mitigate future drought risk and helps in understanding the rainfall variability and pattern for agricultural productivity in Sierra Leone.
INTRODUCTION
The global change in weather conditions in recent times pose some hostile climate uncertainties for both the rich and poor societies (Bangura et al., 2013). According to the Climate Change Vulnerability Index (2014), Sierra Leone is ranked 3rd in terms of economic impacts vulnerability after Bangladesh and Guinea-Bissau. The erratic increase in global temperature due to climate change has impose severe drought (Frazão Santos et al., 2020; Jehanzaib et al., 2020; Vicente-Serrano et al., 2020) and rainfall uncertainties (Wadsworth et al., 2019) with a developing country like Sierra Leone bearing the blunt impact. For the effective management of future unpredictable rainfall pattern and drought risk, reliable information is crucial for such projections. Equally, understanding the consistency of climate variability, drought dynamics and forthcoming changes in precipitation is crucial for Sierra Leone and West African going forward. Also, unpredictable rainfall pattern and drought risk further pose a serious challenge to the socio-economic undertakings in Sierra Leone where majority of the population practice subsistence agriculture as a major backbone of the economy (Wadsworth et al., 2019). Therefore, reliable drought and rainfall knowledge is crucial for the effective managements of future drought risk and rainfall uncertainties in Sierra Leone.
Drought has been experience in almost every part of the earth including humid and wet regions (Dai et al., 2011; AlAwwad et al., 2022). Drought is characterized by provisional and acute water shortage spanning from months to years and it’s an occurrence that has the ability to adversely affects ecosystem function and service, hydrological cycle, life on earth and water resources (Jahangir et al. 2013; Ogunrinde et al., 2019). It’s a complex phenomenon and it has the ability to influence human society, ecosystems, hydropower and agriculture over a period of time (Ionita et al., 2016; Frazão Santos et al., 2017). Dai et al. (2011) describe drought as the recurring extreme climate characterized by below normal precipitation ranging from months to years. About 30% of the global population is impacted by drought risk which account for approximately 5% of natural disasters (Byakatonda et al., 2018; Frazão Santos et al., 2020). Drought is considered as the planet most widely distributed natural disaster affecting economic productivity and livelihood (Thomas et al., 2016; Santos, 2020). Over the years, drought has been found to deplete soil moisture and render soil inappropriate for livestock and crop production and by extension pose a risk of food insecurity (Dai et al., 2011; Abiodun et al., 2019). Abudu et al. (2022), Smith et al. (2022) and Alsubeie (2022) investigated climate risk management and policy.
In Sierra Leone, Bowden (1980) published an article title: Rainfall of Sierra Leone. This article was aim at describing Sierra Leone’s annual rainfall distribution pattern and it variability spanning from 1949 to 1976. Kabba et al. (2012) analyze the coping mechanism to identify the impact weather changes especially in rural areas of Sierra Leone. The most recent rainfall investigation done in Sierra Leone was by Wadsworth et al. (2019) title; Changes in Rainfall in Sierra Leone: 1981–2018. Hayward and Clarke (1996) assessed the relationship that exist between altitude, rainfall and distance from the ocean along the Freetown Peninsular Coast Sierra Leone. They concluded that rainfall in the monsoon increased based on altitude while that of the distance decreased respectively (Hayward & Clarke, 1996). Furthermore, Kamara (2016) conducted an investigation on the variation of intra-seasonal rainfall characteristics in Sierra Leone. The study found that onset of rainy season rainfall starts and end date varies across Sierra Leone.
Base on the available literatures, rainfall variability and drought frequency occurrence information in Sierra Leone is scarce and has rarely been investigated simultaneously. Basically, drought is characterized in three folds: duration, intensity and special coverage (Dai et al., 2011). The rationale for drought analysis in a developing country like Sierra Leone is to identify the severity and likelihood of drought occurrence in the near future. Reliable information on consistent rainfall records in Sierra Leone is still a challenge in this part of the world (Wadsworth et al., 2019). This knowledge gap has led to information deficiency in terms of rainfall variability and drought frequency across Sierra Leone in the 21st century. Although a study was recently done by Wadsworth et al. (2019) on Changes in Rainfall in Sierra Leone: 1981–2018, the study was however, limited to rainfall changes from 1981 to 2018 only and the statistical approach used was different to our study. Therefore, this study intends to close this gap by thoroughly analyzing rainfall changes and drought frequency from 1990 to 2020 respectively. This rainfall changes and drought study was undertaken to prove two hypotheses: 1) rainfall variability is not uniform over the past three decades in Sierra Leone; 2) that drought frequency and occurrences is connected with low rainfall and short precipitation periods. Our study is the first to investigate both rainfall variability and drought occurrence in Sierra Leone spanning from 1990-2019.
MATERIALS AND METHODS
Study area
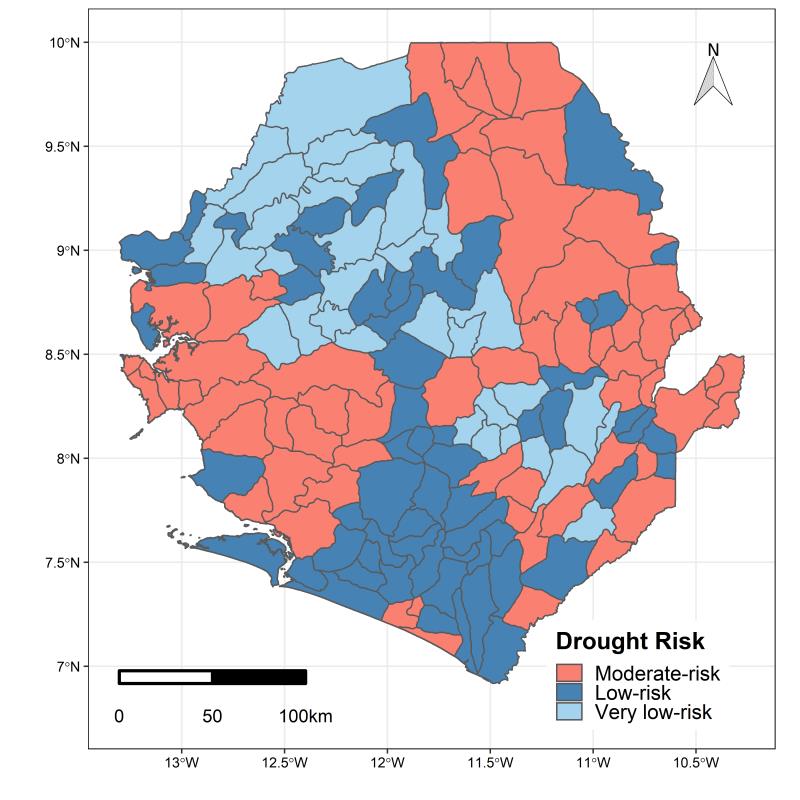
Sierra Leone is among the smallest countries in Africa and West Africa in particular. The country has central coordinates of – 6o55' – 10o14'N and 10o14' – 13o17'W and is located on Africa’s West Coast. Sierra Leone is bordered by Liberia in the south and southeast, Guinea by the northeast and North Atlantic Ocean by the west. The coastal line of Sierra Leone extends to a distance of about 465 (GoSL/UNDP, 2007). The country has an area of 72, 300sq Km (NBSAP, 2017). Sierra Leone is characterized by a predominately hot and humid tropical climate having two pronounced seasons. The rainy season commences in May and ends in October while the dry season starts in November and ends in April (NBSAP, 2017). The average temperature is between 25–27°C while the air humidity average ranges from 70-90. Figure 1a shows drought risk base on regions while Figure 1b shows rainfall distribution pattern in Sierra Leone.
|
|
|
a) |
|
|
|
b) |
|
Figure 1. Map showing drought risk by cities (a) and rainfall (b) occurrence in Sierra Leone from 1990-2020. Figure 1 (a) shows that Sierra Leone’s drought risk situation. |
Data collection
The data for this research was source from satellite and gauged based synthesis and it is on record to have low variability and bias and it’s a combination of ground observation and satellite data data (Funk et al., 2015; Beck et al., 2019; Santos, et al., 2021). The global daily rainfall data at a resolution of 0.05° x 0.05° was collected from Climate Hazards group Infrared Precipitation with Stations (CHIRPS) https://data.chc.ucsb.edu/products/CHIRPS-2.0/global_daily/tifs/p05/. The daily precipitation data were accumulated to obtain the monthly and annual precipitation extending over 30 years × 12 months × 2383 cell grids.
Statistical analysis
All statistical analysis, evaluations and visualizations were carried out using R Studio, version 4.0.3 (R Core Team, 2020), with incorporated functions from the tidyverse-, stats-, gstats- and precintcon-package. The maps showing drought severity used inverse distant weight interpolation method is shown in (Figure 1a).
RESULTS AND DISCUSSION
Precipitation
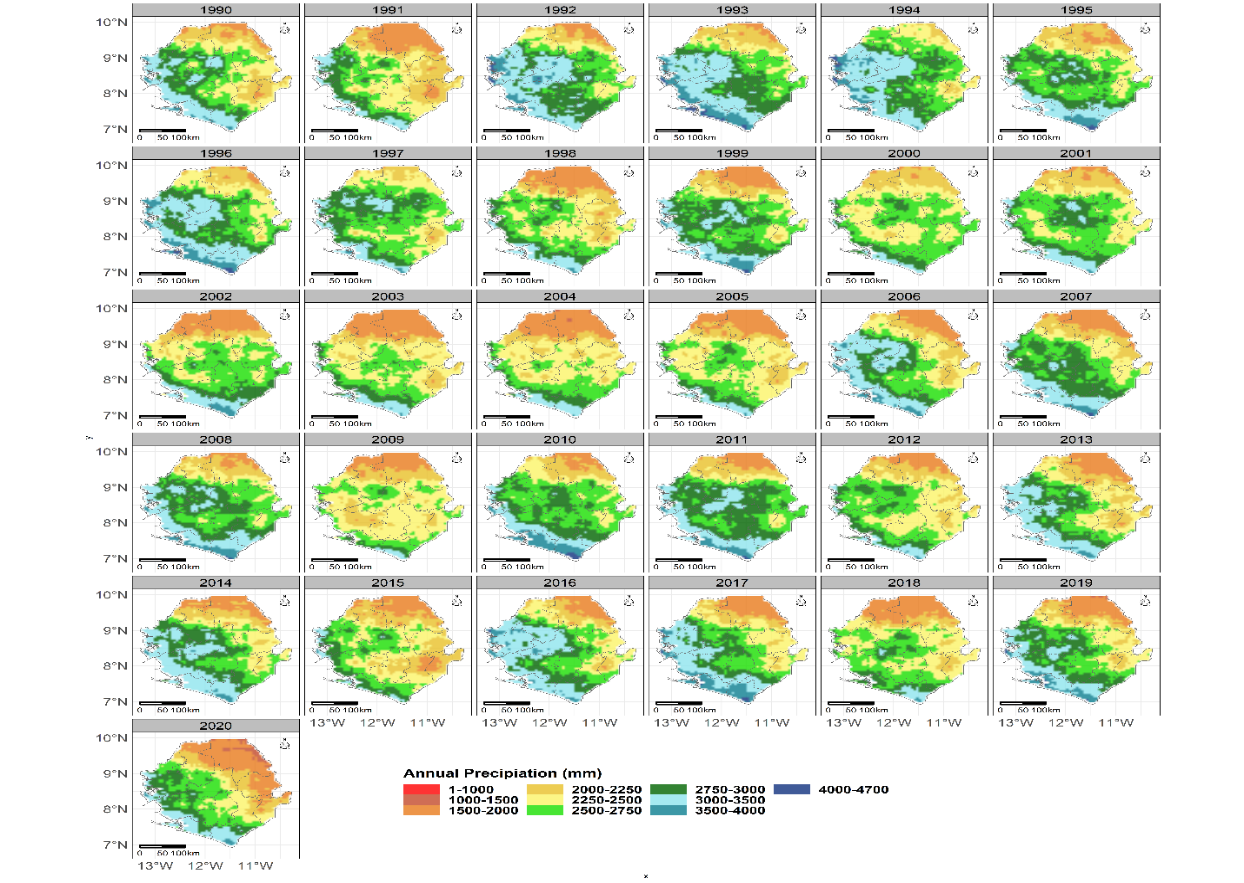
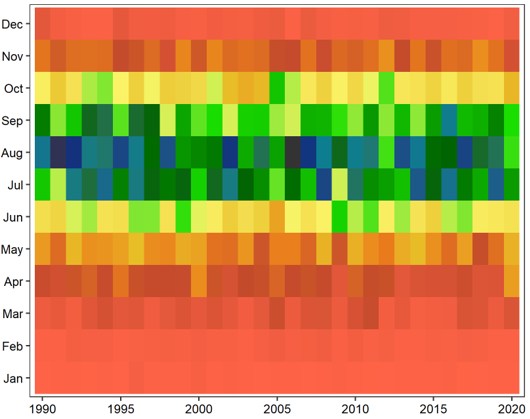
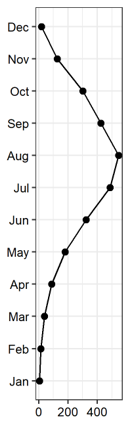
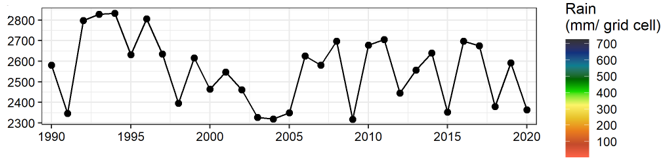
Base on the recommendations of the World Meteorological Organization, the SPI was used to monitor the dry and wet events as it only requires monthly rainfall and can be used to make comparison across regions with ease. This research comprises of a large number of computation of eight SPI scales namely; (SPI-1, SPI-3, SPI-6, SPI-9, SPI-12, SPI-18, SPI-24, SPI-48) time series respectively (Santos et al., 2017; Krasniqi et al., 2022). The study presents the results of SPI at various time scale of rainfall and drought events of Sierra Leone. The time scale equally corresponds with months such as 1, 3, 6, 9. 12. Furthermore, the different time scales correspond with features such as intensity, duration, frequency magnitude and severity of rainfall and drought over the years. The annual precipitation of rainfall from (1990-2020) is presented (Figure 2). The rainfall is less in the northeast part of the country as compared to the west and the south (Figure 3). This scenario could be attributed to vegetation density and cover along the coastal lines in the west and south. A significant decline in precipitation is observed in 2009, 2003, 2004, 2005 and 2015 respectively. However, 1992, 1993, 1994, 1995, 1996, 1997, 2008, 2010 and 2011 were observed as the wettest year over the past three decades as seen in (Figure 2). The precipitation in the east and south is higher than the northern region of the country (Figure 3). Interestingly, the precipitation pattern across the four regions fluctuates slightly over the years as more precipitation was observed in the south-west region as compared to the north- east region. This finding corresponds to that of Wadworth et al. (2019) who discovered that rainfall decline along the northeast but increases along the coast each year. This increase could be attributed to vegetation cover, mountains, mangrove ecosystem and other natural processes. Drought incidence has been categorized for Sierra Leone with threshold values for analysis at time scale of 1, 3, 6-months. This was characterized by periodic drought incidence using the SPI classification. However, the 6-month time scale periodic drought occurrence maybe more durable as compared to 1 and 3-months scale. This assertion corresponds with the findings of (Ajayi & Ilori, 2020). Where the authors concluded that in the near future, West Africa will be experiencing mild and moderate drought incidence as well as hot spot experience overtime.
|
|
|
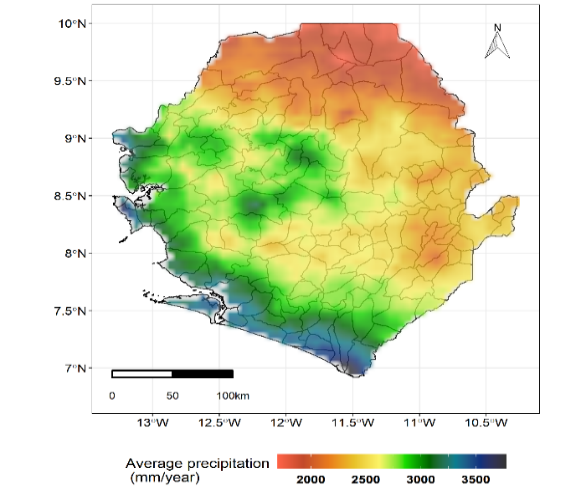
Figure 2. Trend in the annual precipitation (mm) from (1990-2020). Source: Raw data from Climate Hazards Group Infrared Precipitation with Stations (CHIRPS) |
The spatial distribution of the average annual rainfall in Sierra Leone from 1990-2020 is presented in (Figure 2). The highest annual rainfall values recorded were 4700mm while the lowest were 1000mm respectively. Figure 2 shows a clear distinction in terms of annual rainfall per regions in Sierra Leone. The northern region experiences less annual rainfall as compared to the west, south and east. The west is the wettest region in Sierra Leone with annual rainfall reaching 4000-5000 mm per year.
|
|
|
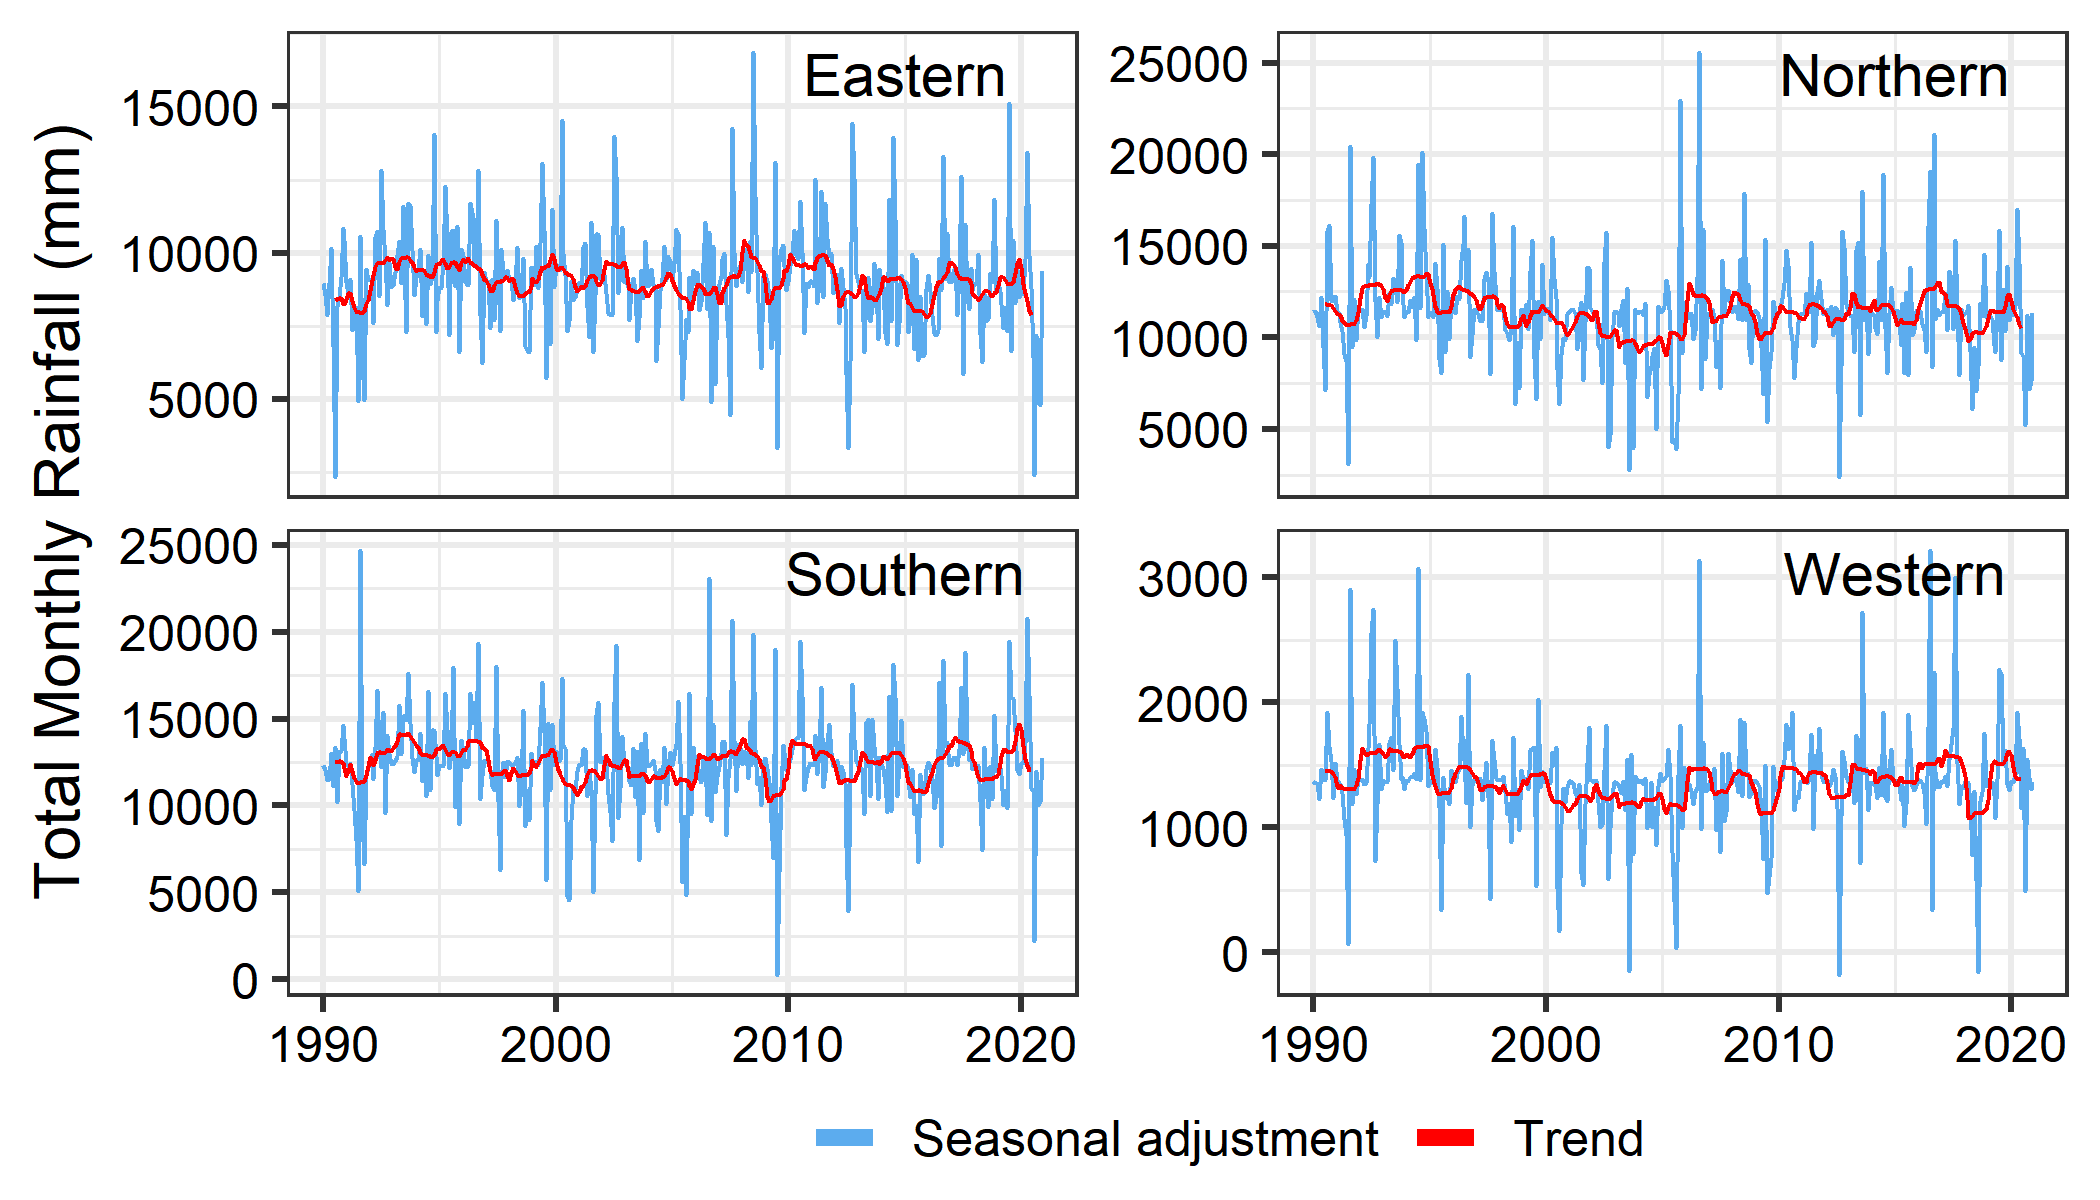
Figure 3. Variability in annual precipitation base on region from 1990-2020. The seasonal adjustment was done by estimating the seasonal component, and subtracting the estimated seasonal component from the original time series |
Figure 3 presents the variability of annual precipitation across the four regions in Sierra Leone. It is observed that, the variability is decreasing across the north as compared to the west. Wadsworth et al. (2019) lend credence to this finding by discovering that, rainfall variability especially during the early rainy season is on the decline in most region in the country. They however, noted that Bonthe and Moyamba districts rainfall variability has increased over the years. as compared to other Districts. The eastern region also shows significant variability in terms of rainfall variability. The increase in rainfall variability across Sierra Leone could be attributed to climate change pattern due to global warming (Nouaceur & Murarescu, 2020).
Table 1. The Mann Kendall Trend Test (sometimes called the M-K test) neg tau reduction in rain sl is the p value based on the four regions in Sierra Leone
|
|
Tau |
sl |
S |
D |
Vars |
Region |
|
1 |
-0.07552966 |
0.02966814 |
-5212 |
69006.01 |
5742833 |
Eastern |
|
2 |
-0.08283336 |
0.01708811 |
-5716 |
69006.01 |
5742833 |
Northern |
|
3 |
-0.04903921 |
0.1580417 |
-3384 |
69006.01 |
5742833 |
Southern |
|
4 |
-0.05295191 |
0.1274197 |
-3654 |
69006.01 |
5742833 |
Western |
|
|
|
|
a) Annual Monthly rainfall distribution |
b) Monthly hyetograph |
|
|
|
|
c) Annual hyetograph |
|
|
Figure 4. A temporal analysis for rainfall from 1990-2020 a; rainfall monthly hyetograph; c annual hyetograph of Sierra Leone |
|
Over the past three decades, (1990-2020), the rainfall behavior is presented in (Figure 4). The total monthly precipitation describes the months with most rainfall (May to October) while the months with less rain fall range from (December to April) in Sierra Leone. The annual hyetograph shows that the early 90s saw a surge in annual precipitation as compared to the early 2000. Most importantly, between 2003 and 2005, the annual rainfall decline greatly to less 2000mm. Over this period, it is assumed the rainfall events shows a noteworthy temporal and spatial variations and could be connected with the reason for drought occurrence in Sierra Leone.
Drought index
|
|
|
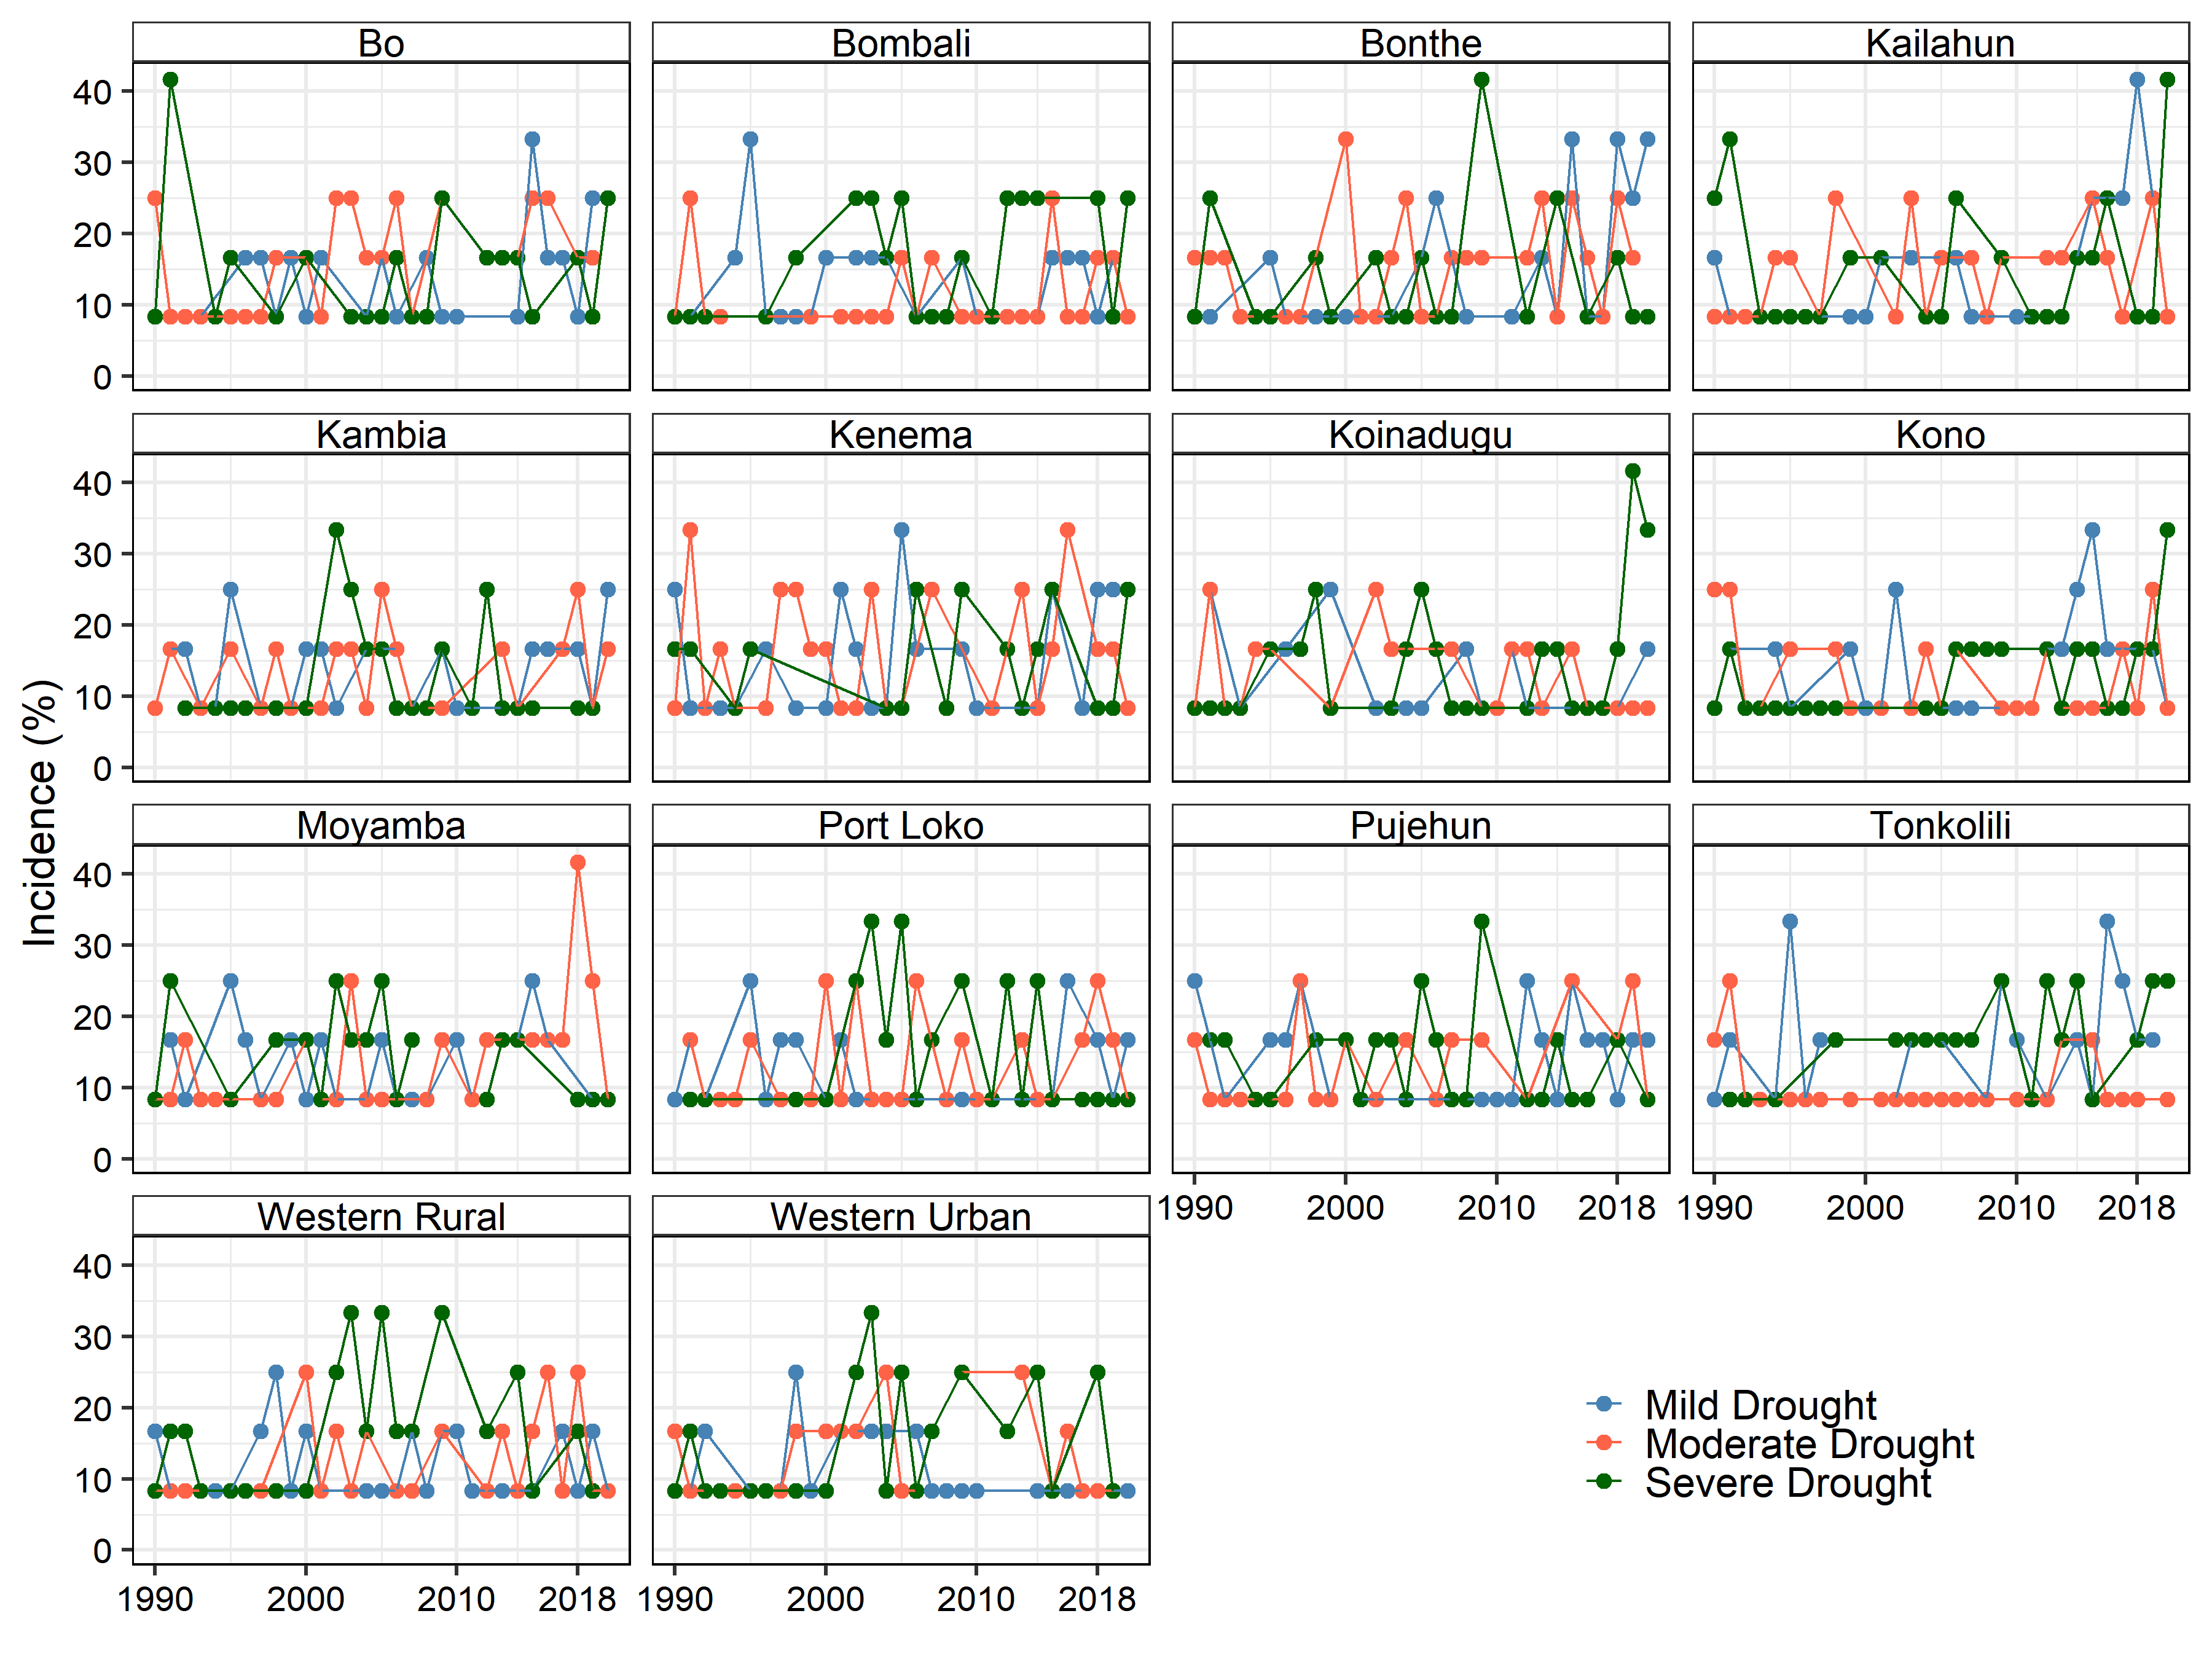
Figure 5. Drought events vulnerability base on Districts |
In general, the regions along the coastal area (western rural and urban) presented a slight drought increase potential as compared to other districts. Koinadugu District present high drought severity prospects followed by Bonthe, Kono, PortLoko and Western urban (Figure 5). Base on the SPI-1 classification, periodic medium term drought occurrence is the most prominent option across Districts like Pujehun, Moyamba, Kambia, Kenema and Tonkolili respectively.
Table 2. The Mann Kendall Trend Test (sometimes called the M-K test) neg tau reduction in SPI sl is the p value
|
Tau |
sl |
S |
D |
Vars |
Adm 1 |
|
-0.05 |
0.148 |
-3464 |
69006.01 |
5742833 |
Bo |
|
-0.099 |
0.004 |
-6865 |
69005.5 |
5742832 |
Bombali |
|
-0.074 |
0.033 |
-5100 |
69006.01 |
5742833 |
Bonthe |
|
-0.066 |
0.057 |
-4556 |
69006.01 |
5742833 |
Kailahun |
|
-0.067 |
0.054 |
-4617 |
69005.5 |
5742832 |
Kambia |
|
-0.054 |
0.12 |
-3722 |
69006.01 |
5742833 |
Kenema |
|
-0.096 |
0.006 |
-6627 |
69005.5 |
5742832 |
Koinadugu |
|
-0.096 |
0.006 |
-6606 |
69006.01 |
5742833 |
Kono |
|
-0.064 |
0.066 |
-4402 |
69006.01 |
5742833 |
Moyamba |
|
-0.077 |
0.028 |
-5282 |
69006.01 |
5742833 |
Port Loko |
|
-0.018 |
0.614 |
-1210 |
69006.01 |
5742833 |
Pujehun |
|
-0.075 |
0.03 |
-5188 |
69006.01 |
5742833 |
Tonkolili |
|
-0.056 |
0.105 |
-3885 |
69005.5 |
5742832 |
Western Rural |
|
-0.04 |
0.244 |
-2794 |
69002.01 |
5742824 |
Western Urban |
The commencement of rainfall in Sierra Leone in the past recent years is unpredictable and the pattern, intensity and duration differ across regions and Districts (Figure 4). According to Figure 4 the month of June to October is considered high precipitation months across the country. Over the years Kailahun, Bo, Pujehun and Kenema recorded more rainfall per District with high SPI-1 values. However, July and August are on record for heavy rainfall across Sierra Leone. Alternately, January, February and March are equally on records as the driest months in the history of Sierra Leone. On the other hand, April and May are considered the transition months into the dry season and they are mostly characterized by inconsistent rainfall and sunshine. Similarly, November and December are considered transition months into actual dry season and are characterized by few rainfall and more sunshine.
|
|
|
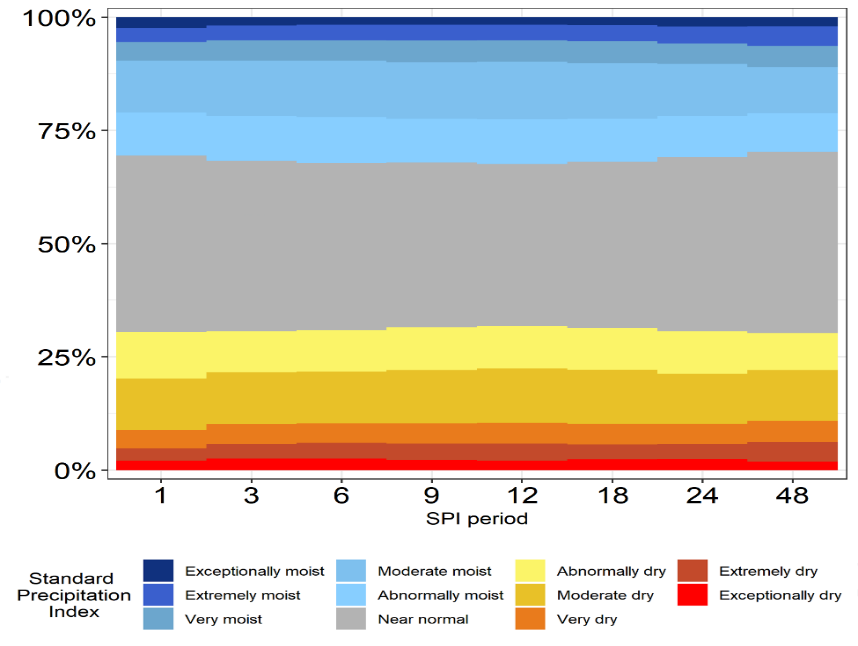
Figure 6. Drought and wet event occurrence percentage for each SPI base on the cumulative average monthly temperature |
Using the cumulative average monthly rainfall, Figure 6 present the percentage of each wet and drought events for each SPI from 1-48 respectively. Base on the Figure 6, more drought events was detected for the short term analysis as compared to less drought events for the long-term analysis. Meaning, there is less drought potential during the long-term analysis and more drought events during the short-term analysis. Similarly, the moderate drought event occurs during a short term analysis of events while the extreme events occurs in medium-term analysis. At 50%, the drought and wet situation is near normal. At around 30% and below, the droughts events tend to be severe and increase accordingly. Thus from (1990-2020) the analysis imply that drought events were moderate in percentage but not in intensity.
|
|
|
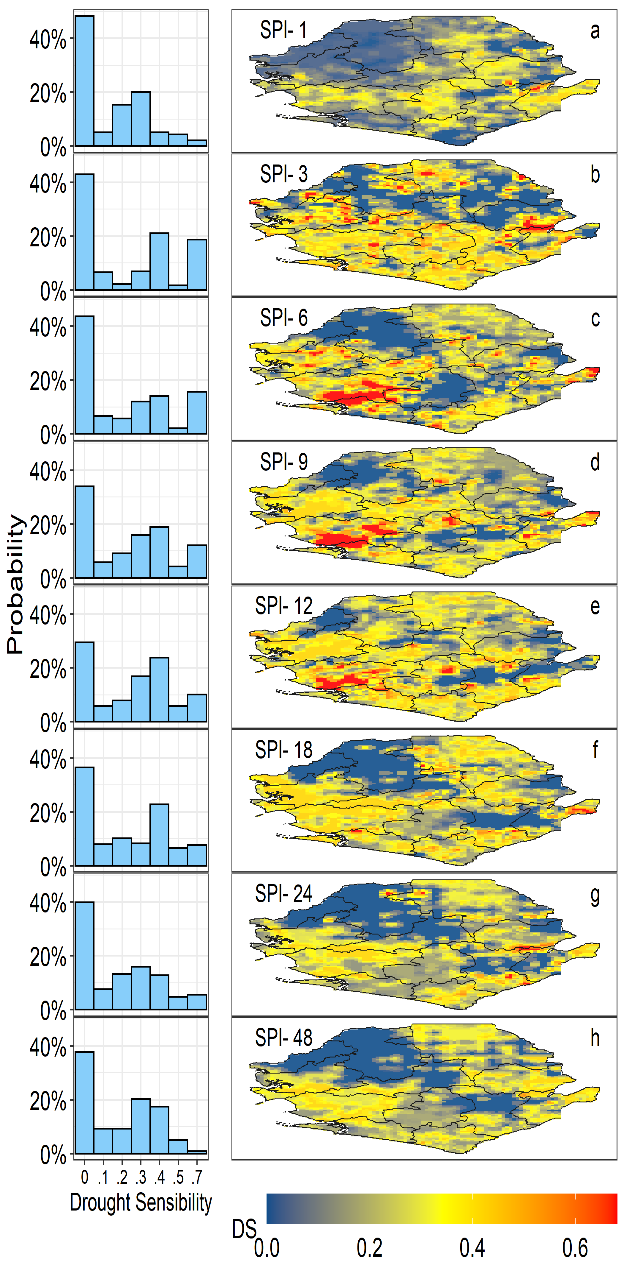
Figure 7. Spatial distribution of drought severity and frequency histogram for a 30-year average (1990-2020). The spatial SPI-1 to SPI-48 of percentage drought events base on the SPI classification and probability distribution. |
Figure 7 presents a comparison of drought events throughout the study period. It was observed that drought severity index values seem to be more important due to time scale increase because drought events assessment are better estimated with longer period data (Santos et al., 2021). This could be attributed to the facts that, mild, moderate, severe and extreme drought incidence displayed lower frequency percentage as compared to standard probability. In the short term, the number of drought events were insignificant (Figure 4a) especially with the SPI-1. However, in the medium-term as seen in (Figures 7b-7e) a slight increase in drought events was detected across the four regions of Sierra Leone but less severe in nature. The long-term as seen in (Figures 7f-7h) showed a high percentage 40% displaying negative values. Fewer drought events occurred during the long-term period than both the short and medium-term base on the SPI classification especially in the northern region of Sierra Leone. This is contrary to most findings (Hickler et al., 2005; Giannini et al., 2008). Base on the analysis across the country, it shows that Sierra Leone is less vulnerable in terms of long term drought but prone to periodic drought in all the three-time series (short, and medium term) and the northern region is more vulnerable due to the low rainfall. The drought behavior of the study area constantly changed along regions over the time series. However, Sierra Leone is better when it comes to drought persistence across West Africa as seen in Mali and Niger (Hickler et al., 2005; Giannini et al., 2008). Nonetheless, the result shows that, the severe drought events across regions depicts that the study area was affected by medium term periodic drought. The results of this study therefore suggest that, high spatiotemporal variability of drought occurred within the 30-year period. The medium term drought potential period was more prominent than the short-term drought events due to high values in regions like the north and east. However, the south-west drought severity values were low implying a low drought occurrence tendency over the 30 years’ period. Base on the fact that drought is controlled by temporal variability which takes place in precipitation, the relevance of precipitation is greater than any other weather indices use to measure drought. Therefore, to halt drought risk increase for a sustainable outcome, effective risk management strategies should be adopted and enforced (Dikici, 2020). Although the coastal areas of Sierra Leone experiences less drought severity risk as compared to the north and other areas. However, drought severity index is not a direct comparison friendly between drought and precipitation situation of different regions due to the fact that, only one value of rainfall time series is considered at a time (Santos et al., 2021; Saravanakumar et al., 2022).
From SPI-1 to SPI-48-time scale, an increment in both temporal drought occurrence and rainfall was observed over the years. The increase in both rainfall and drought incidence could not be unconnected with global warming, land-use/land cover and by extension climate change variability (Nyatuame & Agodzo, 2017). The occurrence of extreme weather incidences like flooding, landslides and mudslides in Sierra Leone could be the direct effect of global warming, climate change over time and unsustainable development (Nyatuame & Agodzo, 2017). Base on the SPI classification, when drought values are continually negative, drought event is said to occur and positive when drought chance of occurrence is null. Similarly, when rainfall values are continually positive, precipitation is intensive and negative values signifies fewer/ no precipitation. The combination of positive drought values in months is refer to drought magnitude (Nyatuame & Agodzo, 2017). Extreme climate change variation continued in the previous year (2020) and is projected to increase in terms of frequency, duration and intensity in the coming years and decades (Ebi & Bowen, 2016). According to the world meteorological organization, 2020 was one of the warmest year on records and such changes increase climate vulnerability risk and hence influence rainfall pattern and drought occurrence (WMO, 2020). What is obvious is that, changes in rainfall precipitation and drought incidence in Sierra Leone has the potential to affects sustainable livelihood and by extension the fragile economy dominated by agricultural activities regulated by unpredictable weather patterns. Thus, decision and policy makers should be able to make crucial weather parameters assessment based on CHIRPS data set analysis. Drought being a slow-starting hydrological events that occur over a time period, adequate monitoring and assessment will yield greater benefits (Dikici, 2020) to would-be vulnerable regions like the northern region of Sierra Leone.
CONCLUSION
In this era of global warming and climate change uncertainties, accurate weather information is essential for a developing country like Sierra Leone in combating extreme rainfall variability and drought events. It was observed that the annual rainfall downpour was more intensive during the months of June, July and August of each year. The western area followed by the southern region recorded more rainfall as compared to the northeastern region. However, the northern region was found more vulnerable to drought incidence as compared to the west and south. The study reveals that drought incidence decreases contrariwise while duration linearly increases base on time scale. The rainfall variability and intensity across regions in Sierra Leone was found not to be uniform especially along the coasts. Similarly, drought characteristics and vulnerability risk differ across regions and was eminent across the northern province. The study presents strong evidence that more drought events occurred or could occur during the long-term period than both the short and medium-term base on the SPI classification especially in the northern region of Sierra Leone. Between 2003 and 2005, the annual rainfall decline greatly to less than 2000mm and that could be attributed to both natural and anthropogenic attributes. The highest annual rainfall ranges from 1000-4700mm with the west being the wettest region in Sierra Leone. The findings of this study can be enhance to mitigate future drought risk and further helps in understanding the rainfall variability and pattern for agricultural productivity and hydro-energy harvest in Sierra Leone. Nonetheless, more studies are needed to thoroughly investigate climatic process and causes of drought in Sierra Leone. Future studies can combine indices such as SPI, SPEI, DI, DS etc. to reduce discrepancies and SPI results limitations and uncertainties.
ACKNOWLEDGMENTS: I wish to acknowledge the academic support provided the Forestry Department, School of Natural Resources Management, Njala University Sierra Leone.
CONFLICT OF INTEREST: None
FINANCIAL SUPPORT: None
ETHICS STATEMENT: None
Abiodun, B. J., Makhanya, N., Petja, B., Abatan, A. A., & Oguntunde, P. G. (2019). Future projection of droughts over major river basins in Southern Africa at specific global warming levels. Theoretical and Applied Climatology, 137(3), 1785-1799. doi:10.1007/s00704-018-2693-0
Abudu, H., Wesseh, P. K., & Lin, B. (2022). Climate pledges versus commitment : Are policy actions of Middle-East and North African countries consistent with their emissions targets? Advances in Climate Change Research, 13(4), 612-621. doi:10.1016/j.accre.2022.06.004
Ajayi, V. O., & Ilori, O. W. (2020). Projected drought events over West Africa using RCA4 regional climate model. Earth Systems and Environment, 4(2), 329-348. doi:10.1007/s41748-020-00153-x
AlAwwad, D. A. A., Al Amri, M. A. F., Al Shaqha, N. K. A., Al Nassar, R. A. M., & Ansari, S. H. (2022). Awareness and treatment decisions on tooth wear among saudi dentists; A cross-sectional survey study. Annals of Dental Specialty, 10(2), 25-34.
Alsubeie, M. S. (2022). Morphology and molecular study of cassia angustifolia vahl. in Saudi Arabia using
RAPD technique. Entomology and Applied Science Letters, 9(2), 11-16. doi:10.51847/434ps9amNE
Bangura, K. S., Lynch, K., & Binns, J. A. (2013). Coping with the impacts of weather changes in rural Sierra Leone. International Journal of Sustainable Development & World Ecology, 20(1), 20-31.
Beck, H. E., Pan, M., Roy, T., Weedon, G. P., Pappenberger, F., Van Dijk, A. I., Huffman, G. J., Adler, R. F., & Wood, E. F. (2019). Daily evaluation of 26 precipitation datasets using Stage-IV gauge-radar data for the CONUS. Hydrology and Earth System Sciences, 23(1), 207-224.
Bowden, D. J. (1980). Rainfall in sierra leone. Singapore Journal of Tropical Geography, 1(2), 31-39.
Byakatonda, J., Parida, B. P., Moalafhi, D. B., & Kenabatho, P. K. (2018). Analysis of long term drought severity characteristics and trends across semiarid Botswana using two drought indices. Atmospheric Research, 213, 492-508.
Dai, A. (2011). Drought under global warming: A review. Wiley Interdisciplinary Reviews: Climate Change, 2(1), 45-65.
Dikici, M. (2020). Drought analysis with different indices for the Asi Basin (Turkey). Scientific Reports, 10(1), 1-12.
Ebi, K. L., & Bowen, K. (2016). Extreme events as sources of health vulnerability: Drought as an example. Weather and Climate Extremes, 11, 95-102.
Frazão Santos, C., Agardy, T., Andrade, F., Calado, H., Crowder, L. B., Ehler, C. N., García-Morales, S., Gissi, E., Halpern, B. S., Orbach, M. K., et al. (2020). Integrating climate change in ocean planning. Nature Sustainability, 3(7), 505-516. doi:10.1038/s41893-020-0513-x
Funk, C., Peterson, P., Landsfeld, M., Pedreros, D., Verdin, J., Shukla, S., Husak, G., Rowland, J., Harrison, L., Hoell, A., et al. (2015). The climate hazards infrared precipitation with stations—A new environmental record for monitoring extremes. Scientific Data, 2(1), 1-21.
Giannini, A., Biasutti, M., & Verstraete, M. M. (2008). A climate model-based review of drought in the Sahel: Desertification, the re-greening and climate change. Global and Planetary Change, 64(3-4), 119-128.
GOSL/UNDP. (2007). Government of Sierra Leone; Ministry of Transport and Aviation annual report 2007. p. 43.
Hayward, D., & Clarke, R. T. (1996). Relationship between rainfall, altitude and distance from the sea in the freetown peninsula, sierra leone. Hydrological Sciences Journal, 41(3), 377-384.
Hickler, T., Eklundh, L., Seaquist, J. W., Smith, B., Ardö, J., Olsson, L., Sykes, M. T., & Sjöström, M. (2005). Precipitation controls Sahel greening trend. Geophysical Research Letters, 32(21).
Ionita, M., Scholz, P., & Chelcea, S. (2016). Assessment of droughts in Romania using the standardized precipitation index. Natural Hazards, 81(3), 1483-1498.
Jahangir, E., Deck, O., & Masrouri, F. (2013). An analytical model of soil–structure interaction with swelling soils during droughts. Computers and Geotechnics, 54, 16-32.
Jehanzaib, M., Sattar, M. N., Lee, J. H., & Kim, T. W. (2020). Investigating effect of climate change on drought propagation from meteorological to hydrological drought using multi-model ensemble projections. Stochastic Environmental Research and Risk Assessment, 34(1), 7-21.
Kamara. M. Y. (2016). Investigating the variation of intra-seasonal rainfall characteristics in Sierra Leone. A project submitted in partial fulfillment of the requirement for the award of postgraduate diploma in meteorology in the department of meteorology university of Nairobi.
Krasniqi, M., & Nallbani, G. (2022). The effect of corticosteroids on macular edema in patients with noninfective uveitis. Journal of Advanced Pharmacy Education and Research, 12(2), 19-22.
NBSAP, (2017). "Government of Sierra Leone ‘s second national biodiversity strategy and action plan (NBSAP) 2017- 2026. Retrieved from https://www.cbd.int/doc/world/sl/sl-nbsap-v2-en.pdf. [Accessed 28 February 2019]," 2017.
Nouaceur, Z., & Murarescu, O. (2020). Rainfall variability and trend analysis of multiannual. Water, 17.
Nyatuame, M., & Agodzo, S. (2017). Analysis of extreme rainfall events (drought and flood) over tordzie watershed in the volta region of Ghana. Journal of Geoscience and Environment Protection, 5(9), 275-295.
Ogunrinde, A. T., Oguntunde, P. G., Akinwumiju, A. S., & Fasinmirin, J. T. (2019). Analysis of recent changes in rainfall and drought indices in Nigeria, 1981–2015. Hydrological Sciences Journal, 64(14), 1755-1768.
Santos, C. A. G., Brasil Neto, R. M., Passos, J. S. D. A., & da Silva, R. M. (2017). Drought assessment using a TRMM-derived standardized precipitation index for the upper São Francisco River basin, Brazil. Environmental Monitoring and Assessment, 189(6), 250-270.
Santos, C. A. G., Neto, R. M. B., do Nascimento, T. V. M., da Silva, R. M., Mishra, M., & Frade, T. G. (2021). Geospatial drought severity analysis based on PERSIANN-CDR-estimated rainfall data for Odisha state in India (1983–2018). Science of the Total Environment, 750, 141258.
Saravanakumar, V., Masi, C., Neme, I., Arjun, K., & Dinakarkumar, Y. (2022). Geographical comparison of phytoconstituents in Euphorbia hirta: A pilot study in Ethiopia and India. Bulletin of Pioneering Researches of Medical and Clinical Science, 1(2), 34-41.
Smith, P., Francombe, J., Lempert, R. J., & Gehrt, D. (2022). Consistency of UK climate risk approaches with new ISO guidelines. Climate Risk Management, 100422. doi:10.1016/j.crm.2022.100422
Thomas, T., Jaiswal, R. K., Galkate, R., Nayak, P. C., & Ghosh, N. C. (2016). Drought indicators-based integrated assessment of drought vulnerability: A case study of Bundelkhand droughts in central India. Natural Hazards, 81(3), 1627-1652.
Vicente-Serrano, S. M., Quiring, S. M., Pena-Gallardo, M., Yuan, S., & Dominguez-Castro, F. (2020). A review of environmental droughts: Increased risk under global warming? Earth-Science Reviews, 201, 102953. doi:10.1016/j.earscirev.2019.102953
Wadsworth, R., Jalloh, A., & Lebbie, A. (2019). Changes in rainfall in sierra leone: 1981–2018. Climate, 7(12), 144.
World Meteorological Organization, (2020). Agricultural climate resilience enhancement initiative (ACREI). [Accessed 27 Janauary, 2021] Avialble from: https://public.wmo.int/en/media/press-release/2020-track-be-one-of-three-warmest-years-record
 This work is licensed under a Creative Commons Attribution 4.0 International License.