The devastating impact of flooding on aquaculture-based businesses has been a topical issue in recent workshops and other public discussions in Nigeria. The survival and growth of aquaculture businesses depend on the profit earned by the operators. Empirical information on the relationship between floods and profitability is scarce. This study examines the relationship between floods and economic returns for fish farmers in Rivers State, Nigeria. This research derives its importance from its relevance to improving flood mitigation strategies among fish farmers. The study used questionnaires, focus group discussions, and personal interviews to generate data for the study. About 92 fish farmers were randomly sampled for the study. Descriptive and inferential statistics were used for data analysis. Descriptive statistics (probability, percentage, and frequency distribution tables) and inferential statistics (binary logistics regression and multiple regression model) were used. The frequency/severity of floods is statistically significant (P ≤ 0.05). The R2 value of 0.6403 (64%) indicates that flooding explains a 64% variation in the profit earned by fish farmers in Rivers State, Nigeria. The result of this study also showed that educational level, income, membership in an association, and frequency of extension contacts are the factors that influence a fish farmer’s willingness to pay for improved flood management preferences. We found sufficient evidence to conclude that effective flood management strategies increase the profit earned by fish farmers.
INTRODUCTION
Floods are recurrent natural disasters that have widespread implications for communities across the globe, causing significant economic, environmental, and social challenges. In regions prone to flooding, such as Rivers State of Nigeria, these climatic events have become a regular occurrence, with increasing intensity and unpredictability in recent years. One of the most vulnerable sectors to the impacts of floods in the study is the aquaculture industry, particularly small-scale fish farming. Floods have been a major challenge to fish farm efficiency and profitability (Olutumise, 2023).
Fakuade (2019) also reported that the profit potential of small-scale fish farming and other aquaculture enterprises is often time affected by floods and other challenges. In concordance, Idris-Adeniyi et al. (2018) reported that fish farming is profitable but noted a low-profit operating margin due to flooding. Alabi et al. (2020) also reported that by 2040, Nigeria and other West African countries are likely to have more losses as a result of floods. Flooding influences fish farming, crop production, and other components of the agricultural system.
Fish farming has experienced a significant boom in the study area due to the sustainability of the study area to climatic conditions and fertile lands. The industry holds immense potential to alleviate poverty, provide employment opportunities, and contribute to flood security. However, the reoccurring issue of floods poses a severe threat to the livelihoods of fish farmers in the region.
This pioneering study delves into the intricate relationship between surging waters and the profitability of fish farming in Rivers State Nigeria. As floods continue to surge, it is imperative to understand how these events impact the operations and income of fish farmers, and more importantly, to identify strategies and preferences of these farmers in mitigating the adverse effects of flooding on their enterprises (Chuckwuere, 2020).
Previous literature (Bassey et al., 2015; Bhatta et al., 2017; Dejo et al., 2020; Week & Wizor, 2020) has offered insights into the general impacts of floods on agriculture, but there is a notable gap in understanding the localized effects of floods on fish farming in Rivers State. This research has explored the specific challenges faced by fish farmers in the study area, taking into account their unique geographic, climatic, and economic conditions (Gbigbi & Okechukwu, 2020; Yousaf et al., 2021) while flood management preferences are crucial to mitigate flood impacts, there is a lack of research that comprehensively examines the range of strategies employed by fish farmers in Rivers State (Achoja & Enwa, 2019; Najim et al., 2023). Understanding the factors that influence their preferences, the effectiveness of different flood management practices, and the barriers to adoption is crucial for developing targeted solutions (Appeaning Addo et al., 2018; Smirnova et al., 2021). There is a gap in assessing the long-term economic resilience of fish farming businesses in the face of reoccurring floods.
The influence of climate on flood patterns and their implication for fish farming in River State is a critical research gap. Understanding how changing climate dynamics interact with local flood events and how fish farmers adapt is essential for long-term resilience planning.
Jena and George (2017) report that during the flood, fish farmers implemented various strategies to potentially lessen the negative effects of flooding on their fish ponds and surrounding ecosystems. These strategies included moving to dry areas during flooding, modifying pond embankments, installing pond fencing, installing netting, caging, and altering river banks, among other things.
According to Issahaku and Abdulai (2020), the expense of obtaining the required supplies rendered adaptation solutions ineffective for small-scale fish farmers operating in remote places. Madukwe et al. (2019) claimed that flooding brought on by climate change poses a threat to fish farmers; nevertheless, by combining their resources and reducing the impact of flooding on their agribusinesses, operators can build resilience. Therefore, in addition to the vast amount of water resources and attention paid to verify the consistent occurrences of floods in the region. It is imperative to pay attention to the profitability, socio-economic and institutional factors influencing profitability, and improved flood management preferences (Kujenga, 2017). In the face of frequent flooding, this research aims to shed light on the socio-economic dynamics, resource use, and resilience tactics used by fish farmers in the study area. By conducting a thorough study, it aims to offer insightful information to politicians, agricultural extension agencies, and farming communities, enabling the creation of focused interventions to protect the aquaculture sector’s profitability and sustainability in the study area. The study aims to assess the extent and nature of flooding severity in Rivers State and analyze the effect of flood severity on the profitability of fish farming enterprises (Ezezue et al., 2017; Xuan et al., 2022).
MATERIALS AND METHODS
Location description/Data collection
Rivers State is the sixth-largest geographic area in Nigeria according to 2006 census data. The state has an indigenously diverse population with major riverine and upland divisions with beautiful cultural heritage. The area is dominated by fish farms. The riverine, including most of the state’s towns and villages surrounded by water which is moderately inhabited.
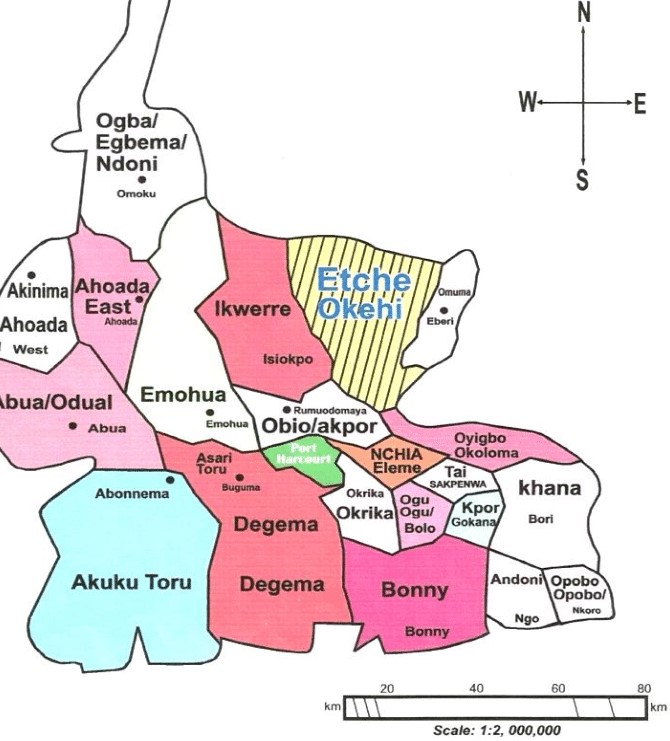
Rivers State is made up of 23 LGAs demarcated into three agroecological zones namely Rivers West, Rivers East, and Rivers South-East. Two riverine LGAs were purposively selected from each of the agroecological zones due to the preponderance of fish farming activities in those LGAs. These LGAs include Ahoada West and Abua/Odua in the Rivers West agro-ecological zone, Ikwerre and Etche in the Rivers East agro-ecological zone, and Tai and Gokana in the Rivers South-East Agro-ecological zone. This was followed by a purposive selection of two communities from each of the previously selected six LGAs to give a total of 12 communities and finally a random selection of five fish farmers from each of the 12 communities giving a total of 96 fish farmers in Rivers State.
Data Collection/Study Area
This article employed a multi-faceted approach, combining questionnaire distribution, focus group discussion, and personal interview to capture the perception/preferences of fish farmer’s response to improved flood management preferences. By evaluating their experiences and preferences in flood management strategies.
Figure 1 is Rivers State, where the study was conducted. The study area is located in the Niger Delta region, it lies between Latitudes 4°20' and 5°50' N and longitudes 6°20' and 7°35' E. The Atlantic Ocean borders it on the south; Imo and Abia states border it on the north; Akwa Ibom State borders it on the east; and Bayelsa State borders it on the west. The former Eastern Region of Nigeria was divided into the state on May 27, 1967. The region that is currently part of Bayelsa State was part of the state until 1996. The state's capital is Port Harcourt, and it has a land area of 11,077 kilometers. Rivers state is amphibious, having both riverine and upland geographical areas. The State is about 45% riverine which supports fish and aquaculture farming. The 2006 census exercise puts the population figure at 5,185,400. There is a healthy mix of people, among whom are the Ikwerre, Kalabari, Ijaw, Ogoni, Obollo, etc. In Rivers State, there are 23 Local Government areas, 4442 Poll Units, 319 Wards, three Senatorial Districts, 13 Federal Constituencies and 32 State Constituencies. Tourism sites in the state include the State Zoo, Elechi Beach, and so on (Nigeria Civil Society Situation Room, 2016).
|
|
|
Figure 1. Map of Rivers State showing the LGAs |
Data analysis
Data collected were analyzed using both descriptive and inferential statistics. Descriptive statistics such as frequencies, percentages, mean, probability (P), and expected value (E) were used. While the inferential statistics include the binary logistics Regression and model regression model. Probability was used to identify the frequency and severity of fish farmers in the study area, descriptive statistics was used to assess the perception of fish farmers to improve flood management techniques.
|
Ƥ (ƑɆ) = ɸ/Ɣ |
(1) |
Where:
Ƥ(ƑɆ) = Probability of flooding event
ɸ = Number of times flooding event occurred
Ɣ = Total number of years (i.e. 10 years)
Assessment of flood severity was achieved using the expected value(ƐѴ).
|
Flood severity =(ƐѴ) = i=1nRLi |
(2) |
Where:
(ƐѴ) = Expected value
RL = Revenue lost to flooding (₦)
Ƥ(ƑɆ) = Probability of flooding
n = Number of flood cases for the past 10 years
Multiple regression model
The implicit form of the model is:
Y = f(X1, X2, X3 … Xn, U), while the explicit form as ;
|
Y = b0 + b1X1 + b2X2 + b3X3 + …bnXn +U. |
(3) |
In the model, Y is the dependent variable, and X1-Xn is the independent variable, which is determined outside the model.
Y= Profitability
X1= Age of farmers
X2= size of fish pond
X3= Educational level
X4= Income of farmers
X5= Membership of association
X6= Frequency of extension contact
ei= Error tem
RESULTS AND DISCUSSION
Table 1. Socio-Economic Characteristics of Fish Farmers
|
Variables |
Frequency |
Percentages % |
|
Gender |
|
|
|
Male |
45 |
48.9 |
|
Female |
47 |
51.1 |
|
AGE |
|
|
|
20-35 years |
13 |
14.1 |
|
36-51 years |
59 |
61.1 |
|
52-67 years |
20 |
21.7 |
|
Above 67 years |
0 |
0.0 |
|
Marital Status |
|
|
|
Single |
72 |
78.3 |
|
Married |
14 |
15.2 |
|
Divorced |
6 |
6.5 |
|
Widowed |
0 |
0.0 |
|
Household Size |
|
|
|
1-4 |
48 |
52.2 |
|
5-8 |
42 |
45.7 |
|
9-12 persons |
2 |
2.2 |
|
Above 12 persons |
0 |
0.0 |
|
Educational Qualification |
|
|
|
No formal |
0 |
0.0 |
|
Primary |
12 |
13.0 |
|
Secondary |
34 |
37.0 |
|
HND/Bsc |
46 |
50.0 |
|
Msc |
0 |
0.0 |
|
Types of Ponds |
|
|
|
Earthen ponds |
72 |
78.3 |
|
Concrete |
19 |
20.7 |
|
Tarpaulin |
1 |
1.1 |
|
Number of Ponds |
|
|
|
1-4 ponds |
92 |
100 |
|
5-8ponds |
0 |
0.0 |
|
9-12 ponds |
0 |
0.0 |
|
Above 12 ponds |
0 |
0.0 |
|
Awareness of farmers to improve flood Mgt. techniques |
|
|
|
Yes |
58 |
63.0 |
|
No |
34 |
36.9 |
|
Adoption of Improved management techniques |
|
|
|
Yes |
57 |
61.9 |
|
No |
35 |
38.0 |
|
Willingness to pay for flood management techniques |
|
|
|
Yes |
74 |
80.4 |
|
No |
18 |
19.6 |
|
If Yes, how much |
|
|
|
#10,000 |
31 |
33.6 |
|
#10,000-#29,999 |
29 |
31.5 |
|
#30,000-#49,999 |
24 |
26.1 |
|
Framing experience |
|
|
|
6-10 years |
24 |
45.7 |
|
11-15 years |
38 |
41.3 |
|
Above 15 years |
2 |
2.2 |
Source (Field Survey 2023)
Age of respondents
The average age of fish farmers was forty-four. This suggests that the fish farmers in the research area were young and in their prime, giving them greater access to information about floods and managing their fish farms. Given that it significantly affects farmers' overall output, age is a significant issue in agriculture (fish farming and aquaculture production) (David et al., 2023).
Educational status
Given that the mean number of years spent in school was 12 (secondary), Table 1 suggests that the fish farmers in the study area had a high level of literacy. Since education gives farmers access to strategies and technologies that would help them lessen the devastating impact of floods on their fish farms, it is viewed as a viable tool in this period of flooding and other climate change disasters. As a result, fish farmers can effectively endure the negative effects of floods on the local fishery (Onyeneke, 2021).
Household size
Given that the average household size was approximately five, it can be inferred that the fish farmers had comparatively large families, some of which may have included dependents and extended family members. This may undoubtedly aid in responding to local flooding and increasing fish productivity. This is also connected to Mbwambo et al. (2021) and Mujeyi et al. (2021). They claimed that a large household was typical of a rural farmer.
Farming experience
An average farmer had eight years of experience. This indicates that the study area's fish farmers have had enough time to acquire the necessary experience and practical knowledge to address the challenges that come with raising fish and dealing with flooding. It is generally accepted that a farmer's chances of mitigating the effects of flood risks increase with experience (Liverpool et al., 2019).
Marital status
About 54% of fish farmers in the study area were married. This implied that married fish farmers tend to be engaged in the fish farming business. However, married fish farmers were known to pay more attention to their business than single or divorced farmers. This may be because of the responsibility of catering for the family and other expenses which made them more committed to their fish farming business (Arimi, 2014).
Awareness of improved flood management techniques
About 63.0% of fish farmers in Rivers State are aware of improved flood management techniques, while 36.9% are not aware. This suggests that a higher percentage of fish farmers know improved flood management techniques. This may be a result of constant workshops and the frequency of extension visits to fish farm locations.
Willingness to pay
Willingness to pay for improved flood management techniques: Among fish farmers, in Rivers State, 80.4% express a willingness to pay for improved flood management techniques, while 19.4% do not. This result suggests that a higher percentage of fish farmers are willing to pay for improved flood management techniques. Danso-Abbeam et al. (2014).
If yes, how much: Fish farmers who are willing to pay for improved flood management techniques, the majority (33.6%) are willing to pay above ₦49,999, while smaller percentages are willing to pay between ₦10,000 - ₦29,999 (31.6%), ₦30,000 - ₦49,999 (8.8%), and below ₦10,000 (7.6%). This result indicates that, on average, fish farmers are willing to pay more for improved flood management techniques. This corresponds to the reports of Ali (2018) where it was stated that fish farming is a very lucrative venture it creates employment opportunities for small-scale farming households in the study area.
Table 2. Flood frequency and severity experienced by fish farmers in Rivers State, Nigeria
|
Probability of flooding event |
(n = 92) |
||
|
Frequency |
Percent |
Mode |
|
|
0.1 |
76 |
82.6 |
0.1 |
|
0.2 |
16 |
16.7 |
|
|
Flood severity |
|
|
|
|
<₦250,000 |
63 |
68.5 |
<# 250,000 |
|
₦250,000 – 499,999 |
7 |
7.6 |
|
|
₦500,000 – 749,999 |
11 |
11.9 |
|
|
₦750,000 – 999,999 |
3 |
3.3 |
|
|
Above₦ 999,999 |
8 |
8.6 |
|
|
Mean ₦314,360.00 |
|
|
|
Source: (Field survey, 2023)
Table 2 provides the result of the flood frequency and severity experienced by fish farmers in Rivers State, Nigeria. Notably, at a probability of 0.1, a substantially higher percentage of farmers (82.6%) were exposed to flooding events This suggests that fish farmers in the study location are more susceptible to flooding at this lower probability level. However, as the probability increases to 0.2, the trend reverses, with a lower severity level of 16.7%. These findings highlight the dynamic nature of flood risk in the region and the need for adaptable strategies to address these disparities. When examining flood severity, fish farmers exhibited a higher percentage of lower-severity floods (<₦250,000) at 68.5%. These disparities in flood risk and severity emphasize the complex landscape of flood vulnerabilities in Rivers State. While the mean flood severity is (₦355,782.86). The study corroborated those of Nnodim and Ezekiel (2020), whose study assessed the causes of flooding in Rivers State and found that illegal structures, poor physical planning, inadequate drainage channels, blockage of canals and drains, collapsed dams, and the nature of the terrain were some of the causes of flooding in the study area. Although the study of Robert et al. (2021) differs from the above study, in his study, he outlined four main causes of flooding, which are: negligence, ignorance, building on waterways, and indiscriminate disposal of waste material as the major causes of floods.
Table 3. Profitability of fish farms in Rivers State, Nigeria
|
Items |
|
||
|
Variable cost |
Quantity |
Price |
Amount (₦) |
|
Fingerlings/ juveniles |
7,184 fishes |
63.06 |
453,023.04 |
|
Feeds |
124 bags |
11,343.21 |
1,406,558.04 |
|
Water |
|
|
33,311.51 |
|
Fuel |
|
|
56,701.04 |
|
Labour |
|
|
32,356.95 |
|
Medication |
|
|
75,894.55 |
|
Veterinary services |
|
|
67,412.42 |
|
Miscellaneous |
|
|
138,813.03 |
|
Total variable cost |
|
|
2,264,070.58 |
|
Fixed cost |
|
|
|
|
Rent |
1 year |
|
105,320.94 |
|
Pond construction |
5 ponds |
192,492.87 |
962,464.35 |
|
Depreciation |
|
|
96246.44 |
|
Total fixed cost |
|
|
1,164,031.73 |
|
Total cost |
|
|
3,428,102.31 |
|
Revenue |
5,232.8 Kg |
1,133.42 |
5,930,960.18 |
|
Gross margin |
|
|
2,866,889.60 |
|
Net revenue |
|
|
1,9,85009.87 |
|
Net Return on Investment |
|
|
0.73 |
Source: Field Survey 2023
Table 3 provides a detailed profitability analysis of fish farms in Rivers State, Nigeria. The analysis evaluates both variable and fixed costs and calculates key profitability indicators.
Variable costs
Variable costs represent the expenses that vary with the level of production. In this case, they include costs related to fingerlings/juveniles, feeds, water, fuel, labour, medication, veterinary services, and miscellaneous expenses. Fish farmers generated a variable cost of ₦2,264,070.58. This can be attributed to several factors, including the quantity and price of inputs and possibly variations in farm practices.
Fixed costs and profitability
Fixed costs, which include items like rent, pond construction, and depreciation, are generally incurred regardless of the level of production. In this analysis, fish farmers have a total fixed cost of ₦1,164,031.73. In terms of profitability, fish farmers demonstrate higher gross margins, generating ₦ 2,866,889.60. The gross margin represents the profit after deducting variable costs from revenue. However, when considering net revenue (profit after accounting for both variable and fixed costs), fish farmers in Rivers State achieve a net revenue of ₦1,9,85009. This considerable difference in profitability underscores fish farming in Rivers State is more financially rewarding, with a net return on investment (ROI) of 0.73. the persistent flooding in Rivers State has taken a toll on fish farmers, diminishing their profitability despite positive expenses- income gap. The excess water disrupts aquaculture operations, causing stress to fish thus leading to lower yields. Consequently, the anticipated profits fall short of the potential, impacting the economic viability of fish farming in Rivers State.
Table 4. Influence of flood severity and associated factors on the profitability of fish farmers in Rivers State
|
Variables |
|
||
|
|
Coefficient |
Standard error |
t-ratio |
|
Constant |
2.0661 |
0.3753 |
5.5048 |
|
Age |
-1.3957*** |
0.1818 |
-7.6767 |
|
Educational level |
2.1365 |
0.3972 |
5.3791 |
|
Feeds |
0.5741 |
1.1493 |
0.4995 |
|
Farmers experience |
-0.0488 |
0.2690 |
-0.1815 |
|
Sex |
0.1776** |
0.0645 |
2.7534 |
|
Frequency of extension contact |
-0.1673 |
0.1867 |
-0.8960 |
|
Membership of association |
0.8365 |
0.7609 |
1.0993 |
|
Flood severity |
-2.3141** |
0.8372 |
-2.7641 |
|
Flood frequency |
-3.8035*** |
0.8280 |
-4.5934 |
|
Amount of money spent during flooding |
-0.4029 |
3.2781 |
-0.1229 |
|
Model summary |
R2 |
Adj. R2 |
F |
|
0.6403 |
0.5997 |
5.6714 |
|
Where: *** and ** are statistically significant at 1% and 5% levels respectively
(Source: Field survey 2023)
Table 4 presents the results of a regression analysis examining the influence of flood risk and associated factors on the profitability of fish farmers in Rivers State.
Age: In Rivers State fish farms, age is statistically significant at a 1% level (t-ratio: -7.6767) and has a negative coefficient (-1.3957). This indicates that older fish farmers have lower profitability.
Sex: Sex is statistically significant at a 5% level (t-ratio: 2.7534) with a positive coefficient (0.1776). This suggests that being male is associated with higher profitability.
Farmer's experience: fish farmer's experience is statistically significant at a 5% level (t-ratio: 2.1158) with a positive coefficient (1.6705). This indicates that more experienced fish farmers have higher profitability.
Flood frequency/ Severity: flood frequency/ severity is statistically significant at a 1% level (t-ratios: -4.5934. The negative coefficient -3.8035 indicates that a higher frequency of floods leads to lower profitability. This result is in line with the report of Ogisi (2017) who reported in their study that the frequency of flooding hurt crop farmers’ income and profitability.
Model summary
The model summary provides an overview of the overall performance of the regression model in explaining the profitability of fish farmers in Rivers State. Here are the key statistics:
R2 (Coefficient of determination): the result presents the R2 value as 0.6403, indicating that approximately 64.03% of the variability in profitability is explained by the independent variables in the model.
Adjusted R2: The adjusted R2 accounts for the number of predictors in the model and penalizes the R2 for overfitting. In this study, the adjusted R2 is 0.5997. These values are slightly lower than the respective R2 values, indicating a good fit and moderate prediction power.
F-Statistic: The F-statistic tests the overall significance of the model. In fish farms, the F-statistic is significant (p < 0.05), indicating that the model, as a whole, has a significant impact on explaining the profitability of fish farmers (Inoni, 2007).
CONCLUSION
The delicate relationship between flooding and the profitability of fish farming in Rivers State demands a new approach to flood management. This pioneering study provides a roadmap for resilience, innovation, and prosperity in the fish farming industry. Understanding the preferences among fish farmers in Rivers State showcases the potential for transformative change, offering hope for a harmonious coexistence of nature and commerce in this dynamic region. By delving into the preferences of fish farmers and their chosen flood management strategies, this research sheds light on the challenges they face and the potential for innovation, traditional practices, modern technology, and adaptive solutions all play a crucial role in navigating the ever-present threat of floods while maximizing profit.
Policy recommendations
The study has highlighted the need for collaborative efforts, involving fish farmers, government agencies, and environmental organizations to develop resilient and sustainable flood management approaches. By harmonizing the interests of economic prosperity and environmental protection, Rivers State can chart a course towards a future where the surging waters could support soaring profits for its fish farming industry. The following recommendations were made;
ACKNOWLEDGMENTS: We wish to extend our gratitude to the fish farmers whose invaluable cooperation and insights greatly contributed to the success of our data collection efforts. Your willingness to share your knowledge and experiences has been instrumental in enhancing the quality of our research. We also acknowledge all the authors whose research was cited.
CONFLICT OF INTEREST: None
FINANCIAL SUPPORT: None
ETHICS STATEMENT: All ethical considerations of this research were observed and followed accordingly.
Achoja, F. O., & Enwa, S. (2019). Aquaculture agribusiness clusters operations around natural water sources: Implications for economic progress in Delta State, Nigeria. Ege Üniversitesi Ziraat Fakültesi Dergisi, 56(1), 101-110.
Alabi, O. O., Oladele, A. O., & Oladele, N. O. (2020). Socio-economic factors influencing perceptions and adaptability of rural rice farmers to climate change, Abuja, Nigeria: Applications of Heckman two-stage model. RJOAS, 8(104).
Ali, A. (2018). Impact of climate-change risk-coping strategies on livestock productivity and household welfare: Empirical evidence from Pakistan. Heliyon, 4(10).
Appeaning Addo, K., Jayson-Quashigah, P. N., Codjoe, S. N. A., & Martey, F. (2018). Drone as a tool for coastal flood monitoring in the Volta Delta, Ghana. Geoenvironmental Disasters, 5(1), 1-13. doi:10.1186/s40677-018-0108-2
Arimi, K. S. (2014). Determinants of climate change adaptation strategies used by fish farmers in Epe local government area of Lagos state, Nigeria. Journal of the Science of Food and Agriculture, 94(7), 1470-1476.
Bassey, N., Uwemedimo, E., Uwem, U., & Edet, N. (2015). Analysis of the determinants of fresh fish marketing and profitability among captured fish traders in South-South Nigeria: The case of Akwa Ibom State. British Journal of Economics, Management & Trade, 5(1), 35-45.
Bhatta, G. D., Ojha, H. R., Aggarwal, P. K., Sulaiman, V. R., Sultana, P., Thapa, D., Mittal, N., Dahal, K., Thomson, P., & Ghimire, L. (2017). Agricultural innovation and adaptation to climate change: Empirical evidence from diverse agro-ecologies in South Asia. Environment, Development and Sustainability, 19(2), 497-525.
Chuckwuere, J. (2020). Social media age: Where is the Spirit of Ubuntu in the educational system. African Journal of Social and Humanities Journal, 1(1), 1-6.
Danso-Abbeam, G., Addai, K. N., & Ehiakpor, D. (2014). Willingness to pay for farm insurance by smallholder cocoa farmers in Ghana. Journal of Social Science for Policy Implications, 2(1), 163-183.
David, U. K., Enwa, S., Oyita, G. E., & Udeh, N. H. (2023). Effect of oil spills and gas flaring on agriculture and environment: A case of crop farmers in Niger Delta Region of Nigeria (2000 - 2022). International Journal of Biosciences, 22(3), 30-50.
Dejo, A., Adelaja, S. S., Ogede, O. A., Omoniyi, A. M., & Olaoye, O. J. (2020). Economic efficiency and profitability of fish hatchery enterprise, in Osun state, Nigeria, Nigeria. Agricultural Journal, 51(2), 337-345.
Ezezue, B. O., Agha, N. C., Ndieze, J., & Serieke, D. R. (2017), Effective management of flooding in Nigeria (a study of selected communities in Anambra State Nigeria), Nigerian. Journal of Management Sciences, 6(1).
Gbigbi, T. M., & Okechuku, I. (2020). Analysis of the nexus in agricultural insurance welfare and climate change adaptation decision: Evidence from Nigeria analysis of the nexus in agricultural insurance welfare and climate change adaptation decision: Evidence from Nigeria. Yuzuncu Yıl University Journal of Agricultural Sciences, 30(1), 100-114.
Idris-Adeniyi, K. M., Busari, A. O., Badmus, A. O., & Adeniyi, R. T. (2018). Economic analysis of catfish production among fish farmers in Osogbo metropolis, Osun State, Nigeria. UNIOSUN Journal of Sciences, 3(1), 103. https://www.researchgate.net
Inoni, O. E. (2007). Allocative efficiency in pond fish production in Delta State, Nigeria: A production function approach. Agricultura Tropica et Subtropica, 40(4), 127-134.
Issahaku, G., & Abdulai, A. (2020). Adoption of climate‐smart practices and its impact on farm performance and risk exposure among smallholder farmers in Ghana. Australian Journal of Agricultural and Resource Economics, 64(2), 396-420.
Jena, J. K., & George, G. (2017). Climate and climate variability: impact on fisheries in food and nutritional security. Agriculture under Climate Change: Threats, Strategies and Policies, 1, 38.
Kujenga, A. (2017). Challenges to food security in Nigeria’s oil-rich Niger Delta region. Journal of Science and Technology, 4(11), 231-267.
Liverpool-Tasie, L. S. O., Sanou, A., & Tambo, J. A. (2019). Climate change adaptation among poultry farmers: Evidence from Nigeria. Climatic Change, 157(3-4), 527-544.
Madukwe, M. C., Nwoye, I. N., Osegbue, E. G., & Kadiri, A. O. (2019). Effects of flooding on small scale farmers in Anambra, Nigeria. Noble International Journal of Agriculture and Food Technology, 20(30), 31-40.
Mbwambo, S. G., Mourice, S. K., & Tarimo, A. J. (2021). Climate change perceptions by smallholder coffee farmers in the Northern and Southern Highlands of Tanzania. Climate, 9(6), 90.
Mujeyi, A., Mudhara, M., & Mutenje, M. (2021). The impact of climate smart agriculture on household welfare in smallholder integrated crop–livestock farming systems: Evidence from Zimbabwe. Agriculture & Food Security, 10(1), 1-15.
Najim, S. M., Abd, M. R., Fadhil, A. A., & Hassan, A. F. (2023). Fimasartan attenuates edema and systemic changes in egg albumin-induced paw inflammation in rats. Journal of Advanced Pharmacy Education and Research, 13(1), 127-133.
Nigeria Civil Society Situation Room. (2016), htpps:/situationroomng.org/wp-content/uploads/2016/02
Nnodim, A. U., & Ezekiel, C. (2020). Perceived impact of perennial flooding on livelihood activities of rural dwellers of Orashi region of rivers state. International Journal of Innovative Human Ecology and Nature Studies, 8(2), 12-18.
Ogisi, H. A. (2017). Analysis of flood vulnerable areas in Benin- Owena river basin, Nigeria. Indonesian Journal of Geography 49(1), 28.
Olutumise, A. I. (2023). Impact of rexaing flood policy interventions: Lessons from earthern ponds based farmers in South Eastern Nigeria. Aquaculture International, 43(2).
Onyeneke, R. U. (2021). Does climate change adaptation lead to increased productivity of rice production? Lessons from Ebonyi State, Nigeria. Renewable Agriculture and Food Systems, 36(1), 54-68.
Robert, U. O., Mark Umunna, A., Njoku, C. L., & Osuji, E. E. (2021). Climate change perception and uptake of climate-smart agriculture in rice production in Ebonyi state. Atmosphere, 4(2), 10-90.
Smirnova, E. A., Stolyarova, А. N., Surnina, K. S., Denenberg, Y. M., & Dikova, T. V. (2021). Impact of the COVID-19 pandemic on the development of digital technologies in academic education. Journal of Advanced Pharmacy Education and Research, 11(1), 207-213.
Week, D. A., & Wizor, C. H. (2020). Effects of flood on food security, livelihood and socio-economic characteristics in the flood-prone areas of the core Niger Delta, Nigeria. Asian Journal of Geographical Research, 3(1), 1-17.
Xuan, E. Y. H., Razak, N. F. A., Ali, A. M., & Said, M. M. (2022). Evaluation of knowledge, attitudes, and perceptions on halal pharmaceuticals among pharmacy students from Malaysian private universities. Journal of Advanced Pharmacy Education and Research, 12(1), 84-90.
Yousaf, M., Khan, M. M., & Paracha, A. T. (2021). Leading professionally diverse workgroups of healthcare professionals for improving quality of care. Journal of Organizational Behavior Research, 6(1), 106-119.
 This work is licensed under a Creative Commons Attribution 4.0 International License.