Coronavirus diseases-2019 (COVID-19) pandemic emerged in late 2019 and many countries initially adopted partial or complete lockdown measures to restrict the transmission of the disease, as effective drugs or vaccines were unavailable till then. Imposing lockdown drastically reduced anthropogenic and commercial activity. All types of large and small industries and markets were closed; all sorts of public and commercial transportation, except for the essential ones, along with railways and flights were completely shut off. Worldwide reports and research indicating that COVID-19 induced lockdown might have a crucial impact on the global environment. During the lockdown, air and water quality improved significantly due to low atmospheric pollution, environmental noise reduced and wild lives are also blooming. COVID-19 may be nature’s warning to the human being; when human beings are confined in homes for saving their lives, nature takes advantage and try to heal herself. Based on available research and media reporting, in this article, we try to summarize the episode of COVID-19 induced lockdown and its effect on the environment especially emphasizing the Indian context.
INTRODUCTION
Coronaviruses are a group of viruses that infect humans through zoonotic transmission. After Severe Acute Respiratory Syndrome (SARS) and Middle East Respiratory Syndrome (MERS) (Zhong et al., 2003; Ramadan & Shaib 2019; Magomedova et al., 2020) in the last two decades, in late December 2019, a novel infectious disease was identified in the Wuhan city of China (Rivas et al., 2020; Parishani et al., 2021). The International Committee on Taxonomy of Viruses (ICTV) named the virus “severe acute respiratory syndrome coronavirus 2” (SARS-CoV-2) (Gorbalenya et al., 2020; Yusupova et al., 2021), and the disease was named COVID-19 (Chen et al., 2020) on February 19, 2020, by World Health Organization (WHO). With affecting more than 175.5 million people and causing nearly 3.8 million deaths (as of 14th June 2021) in more than 200 countries, so far, the COVID-19 is the largest pandemic on the earth (WHO, 2020a). SARS-CoV2 is a member of the β-coronavirus subgroup under the Coronaviridae family (Pyrc et al., 2007) having glycoprotein spikes like a crown on its surface with a diameter ranging between 65-125 nm. COVID-19 is transmitted from person to person through respiratory droplets expelled by the infected person’s coughing, sneezing, talking, singing, or spread by touching fomites (Bouey et al., 2020). Recently, WHO (on 9th July 2020) admitted that the virus can also be transmitted through the air (WHO, 2020b). This newly-born disease has a long incubation period ranging between 2-14 days with symptoms like breathing difficulty, dry cough, fever, mild pain or pressure in the chest, and blue lips (CDC, 2020). Initially, there are no specific effective drugs to prevent the disease (Cortegiani et al., 2020). Some preexisting antibacterial and antiviral drugs such as favipiravir, remdesivir, tocilizumab, ivermectin, and lopinavir are used to combat this disease (Paital et al., 2020). There are approximately 300 promising vaccine candidates under trial, among which 102 are under clinical trial and the rest are under preclinical evaluation (WHO, 2020c). National Regulatory Authorities recently approved sixteen vaccine candidates, for emergency mass vaccination purposes (WHO, 2021).
The emergency committee of WHO, on 30th January 2020, declared the disease as a global health emergency (WHO, 2020d). Initially, due to a lack of effective medicine or vaccine, the social lockdown was the only way to maintain less human interaction for preventing this disease from spreading (Paital et al., 2020). Several countries implemented these lockdown measures at different stages of infection; China imposing lockdown from the end of January 2020 in Wuhan, whereas in Italy the nationwide lockdown was first applied from 09th March 2020, and in Spain, Australia, United Kingdom, and France, the lockdown measure was imposed on 14th March 23rd March, 23rd March, 17th March 2020, respectively (Wikipedia, 2020a).
In India, the first confirmed positive case of COVID-19 was reported from Kerala on 13th January 2020 (India Today, 2020) and now India holds 2nd position with 29,510,410 confirmed cases and 374,305 deaths as of 14th June 2021 (Worldometer, 2020). With 500 confirmed cases, the Prime minister requested all the citizens of the country to observe a 14 hrs (7.00 A.M-9.00 P.M. IST) voluntarily social distancing campaign, observed as Janata curfew on 22nd March 2020 (The Hindu, 2020a), followed by a nationwide imposed locked down from 25th March 2020 with initial duration for 21 days and extended till June 30th. Step by step unlocking procedure was started but till now, to control the second wave of COVID-19, state governments are imposed a lockdown on a regional scale (Wikipedia, 2020b; Indian Express, 2021). Different phases of lockdown are implemented with different rules and levels of restrictions to maintain strict social distancing as a measure to reduce the effects and transmission of Coronavirus (Somani et al., 2020). In general, under the nationwide lockdown, all the academic institutions, industries, multiplex, shopping complexes, restaurants, and similar public places were closed. All sorts of transportation services including railways and flights were suspended except the essential one. The lockdown affected the Indian economy but led to a dramatic decrease in air pollution and improvement of overall environmental health including surface water quality, GHG emissions, noise level, and organic and inorganic west product generation.
The total or partial social lockdown around the planet to flatten the pandemic curve results in less anthropogenic and economic activity and human-environment interaction and led to a decrease in pollution (The Gurdian, 2020; Tung et al., 2021). In a nutshell COVID-19, the biggest pandemic and curse to human civilization to date may be a warning for us from Nature to stop destroying the natural resources, on the other side when we are quarantined at home to prevent this fatal disease, nature is trying to heal itself.
In this article, we try to sum up the impact of COVID-19-induced lockdown on the global environment almost on every aspect (air pollution, water pollution, noise pollution, greenhouse gas (GHG) emission, biodiversity, and wildlife) with emphasizing the Indian context using available literature, news from media and various regulatory authorities.
COVID-19 and status of air pollution
To live on the earth, ambient air quality is the essential one; although globally 91% of people live under poor air quality (WHO, 2016). Air pollution is responsible for 4.6 million deaths globally (Cohen et al., 2017). The concentration of particulate matter (PM) is one of the major parameters to measure air quality. The high PM2.5 is responsible for adverse health effects causing chronic obstructive pulmonary disease (COPD), respiratory infection (GBD, 2018), is declined in various cities all over the world due to lockdown measures. In Zaragoza (city of Spain) the PM2.5 significantly decreased 58% in March 2020 compared to February 2020; in Rome, the average PM2.5 value lowered 24 % in March 2020 compared to the value of February 2020. In Dubai (UAE) the PM2.5 reduced by 11% during March 2020 compared to March 2019 (Chauhan & Singh, 2020). According to the Copernicus Atmospheric Monitoring Service (CAMS) of the European Union, in a large area of China mean value of PM2.5 reduced up to 20-30% in February when compared to the mean value of February 2017, 2018, and 2019 (Zambrano-Monserrate et al., 2020). A study to analyze the PM2.5 of fifty most polluted capital cities of different countries around the world reported an average 12% reduction in PM2.5 concentration worldwide with the highest reduction in the African continent by 33% followed by a 22 % reduction in America and 16 % in Asia; finally, in European countries the reduction level was only 5% due to lockdown in last year (Table 1) (Rodríguez-Urrego & Rodríguez-Urrego, 2020). Nitrogen dioxide (NO2) is a highly reactive air pollutant emitted from vehicles and industrial activity and causes inflammation, and respiratory distress (He et al., 2020a; He et al., 2020b). National Aeronautics and Space Administration (NASA) and European Space Agency (ESA) released images, of several nations before and during the lockdown, using Ozone Monitoring Instrument (OMI) through the AURA satellite and Tropospheric Monitoring Instrument (TROPOMI) through the Sentinel-5P satellite to capture the data suggests a reduction in NO2 concentration up to 30 % with improved environmental quality (Table 2). Heavy changes in NO2 concentration were observed in the middle of March 2020, onwards in South Asia and South-East Asian countries including a large part in India, due to the closure of industries and transportation service. Similar changes were recorded in Western Africa and Europe (Lal et al., 2020). Carbon dioxide (CO2), another major air pollutant has led to a sharp decline of approximately 17% by 7th April 2020 when compared to 2019 levels due to the peak in global lockdown. The carbon emission was reduced by 23.9 %, 30.7 %, and 31.6 % in China, UK, and USA, respectively. In India, carbon emission was reduced by 26 % (Le Quéré et al., 2020).
In India, gradual improvement in the overall air quality was also observed. Air Quality Index is an important value to measure the overall air pollution due to principal air pollutants; the lower the AQI value and air quality are inversely related. During the complete lockdown period in 2020, the Air Quality Index (AQI) of the country was 30% reduced when compared to 2019. The north, south, east, west, and central regions of India experienced a 44, 33, 29, 32, and 15 % decline in AQI value, respectively (Sharma et al., 2020). The average AQI of Delhi, which was around 300-400, drastically reduced to 94, during the lockdown phase. According to Sentinel-5P satellite captured data, the NO2 concentration in India was reduced by almost 40-50% (Figure 1) across the major cities of India compared to the same time frame of the previous year (Lokhandwala & Gautam, 2020). During the initial lockdown period (16th March to 14th April 2020), in 22 cities of India PM10, PM2.5, carbon monoxide (CO) was reduced by 43, 31, and 10 %, respectively (Arora et al., 2020). In Delhi and Mumbai, PM2.5 was reduced by 35% and 14%, respectively when compared to March 2019 (Chauhan & Singh, 2020) and a similar pattern of PM2.5 reduction was also observed in other cities of India, (Table 3). Even in this year, due to the second wave of COVID-19, after the starting of lockdown in mid-April 2021, the air quality is similar to that of last year, when a nationwide lockdown was implemented in March 2020. The average PM2.5 for May of both years is almost identical at about 55-56 µg/m3. However, this value is about 42 percent lower than the value in May 2019, when there was no lockdown (India Today, 2021).
Table 1. Percentage of PM 2.5 Reduction in World’s Different Cities Due of COVID-19 Lockdown
|
City |
% Reduction in PM 2.5 |
Time |
Source |
|
Newyork, USA |
20% |
Feb 2020 and Mar 2020 |
Chauhan and Singh, 2020 |
|
Los Angles, USA |
30% |
Feb 2020 and Mar 2020 |
|
|
Zaragoza, Spain |
58% |
Feb 2020 and Mar 2020 |
|
|
Rome, Italy |
24% |
Feb 2020 and Mar 2020 |
|
|
Dubai, UAE |
11% |
Mar 2019 and Mar 2020 |
|
|
Delhi, India |
35% |
Mar 2019 and Mar 2020 |
|
|
Dhaka, Bangladesh |
24% |
Feb 2020 and April 2020 |
|
|
Tehran, Iran |
39% |
Feb 2020 and April 2020 |
Rodríguez-Urrego & Rodríguez-Urrego, 2020 |
|
Astana, Kazakhstan |
18% |
Feb 2020 and April 2020 |
|
|
Santiago, Chile |
10% |
Feb 2020 and April 2020 |
Table 2. Nitrogen dioxide (NO2) Emission data of Different Countries during Lockdown
|
City |
% Reduction in PM 2.5 |
Time |
Source |
|
Delhi |
35% |
Mar 2019 and Mar 2020 |
Chauhan & Singh, 2020 |
|
Mumbai |
14% |
||
|
Chennai |
32% |
Mar- May 2019 and Mar-May 2020 |
Kumar et al., 2020 |
|
Hydrabad |
26% |
||
|
Kolkata |
24% |
||
|
Jaipur |
50.5% |
Mar- May 2019 and Mar-May 2020 |
Navinya et al., 2020 |
|
Lucknow |
51.5% |
||
|
Ahemedabad |
67.7% |
||
|
Nagpur |
52.6% |
||
|
Bangalore |
45.4% |
||
|
Chennai |
30.2% |
|
|
|
Figure 1. Nitrogen Dioxide (NO2) Concentration Before and During COVID-19 Lockdown, 2020 in India (Image Source- Earthsky, 2020) |
Table 3. Percentage of PM 2.5 Reduction in Different Cities of India Due to COVID-19 Lockdown
|
Location |
Time |
% Reduction |
Source |
|
Spain |
Mar 2019 and Mar 2020 |
20-30% |
Muhammad et al., 2020 |
|
USA |
Mar 2015–19 and Mar 2020 |
30 % |
|
|
France |
Mar 2019 and Mar 2020 |
20-30% |
|
|
Italy |
Mar 2019 and Mar 2020 |
20-30% |
|
|
China |
Jan and Feb 2020 |
20-30% |
|
|
Europe |
Mar 2019 and Mar 2020 |
20-30% |
|
|
India |
Mar- Apr 2019 and Mar -Apr 2020 |
40-50% |
Lokhandwala et al., 2020 |
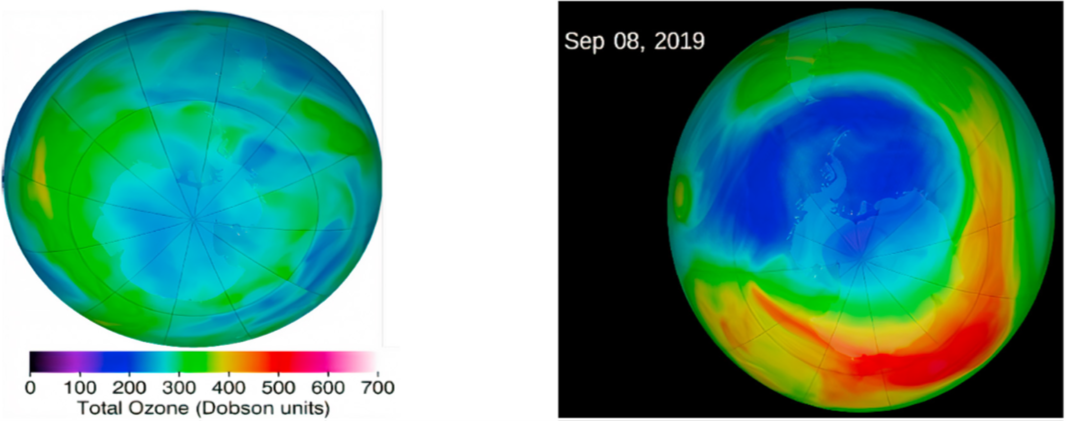
Impact on GHG emission and ozone hole
In the last few years, the amount of GHG emission throughout the world meets a new peak (Global Climate report, 2019). CO2 emission rising by 1% per year for the last one decade without changing its pattern till 2019 (Le Quéré et al., 2020). The International Energy Agency estimated a fall of 8 % in CO2 emission (equivalent to 2600 Mt. CO2) during this global lockdown. Some agencies have also expected a reduction in CO2 emission by more than 5%, the highest annual reduction to date (Scientific American, 2020). Imposing Global lockdown at different times results in a daily reduction of global CO2 emission by 17% by 7th April 2020. The change in global CO2 emission rate was highest on 7th April during the last 4 months of 2020 (1st January to 30th April) with an average decrease of 26% in individual countries (Le Quéré et al., 2020).
|
|
|
|
a) |
b) |
|
Figure 2. The Hole in the ozone layer over Antarctica on 23rd May 2020 and September 08, 2019, respectively (Image source- Arora et al., 2020) |
|
Implementation of strict lockdown by the Indian government to reduce human interaction, also effectively decreased carbon emission by almost 15% during March 2020 and estimated to reach to 30% level at the end of April (Myllavirta & Dahiya, 2020). Just within 10 days of lockdown, the overall power consumption of India decreased up to 20% compared to the usual consumption level. The thermal power generation sector is one of the major GHG emitting sources, dropped GHG emissions by 31% within the first 21 days of April 2020. Following a similar trend in electricity demand, consumption of fossil fuels and natural gas was also reduced during this lockdown, which ultimately led to a significant reduction in GHG emissions (Myllavirta & Dahiya, 2020).
After implementing Montreal Protocol to save the ozone layer, the stratosphere healed 1-3% per decade in the last 20 years and expected to get back its heath as it was in 1980 in the next 50 years. NO2, CO2, and various GHG and ozone-depleting substances emissions were reduced during lockdown with a simultaneous increase in surface ozone concentration. During lockdown Copernicus, atmospheric monitoring services (CAMS) confirmed that the largest ozone hole of about 1 million square kilometers over the arctic region has been healed (Figure 2) (India Times, 2020). It has been presumed that healing of arctic ozone hole due to reduced emission of GHG and other pollutant triggering by COVID-19 lockdown. However, later scientists reported that ozone layer healing is due to the polar vortex unrelated to the change in lockdown-induced pollution level (Arora et al., 2020).
COVID-19: impact on noise pollution
Anthropogenic activity generated unwanted sound can be defined as environmental noise, which is a prime factor for discomfort and disease of human population and also harmful for the environment and other animals of the earth (Zambrano-Monserrate et al., 2019). Most noise pollutions are generated due to anthropogenic activity (Paital, 2020). Long-time exposure to high noise may play a crucial role in irritation, mental stress, hypertension, concentration loss, and insomnia (Öhrström, 1989; Stansfeld et al., 1996; Rabinowitz, 2000; WHO, 2005; Banerjee et al., 2008). An extreme level of sound pollution can cause stroke, heart attack, and dementia (European Union, 2015). In major cities of India generally, the average noise level ranged between 45-86 decibels (db) during the day and 37-76 db during the night. In the residential area, the diurnal noise level is between 63-90 db and 46-78 db, whereas the same for the commercial area are 50-89 and 40-70 during day and night, respectively (Arora et al., 2020). A steep reduction in the noise level has been observed during the lockdown period last year. Global data indicating traffic movement drop down by 54, 36, and 19% in the UK, US, and China, respectively (Somani et al., 2020).
In India, after imposing lockdown, flights, trains, buses, and all other vehicles are stopped except some freight trains and vehicles associated with essential services. For the first time in Indian transportation history, no mail or passenger trains are in operation from 22 March 10:00 PM, 2020 (Hindustan Times, 2020a). With this cessation of transportation, there was a dramatic decrease in noise pollution in Indian cities with an estimated reduction in noise pollution ranged between 35-68 db from 8 AM to 4 PM. In Kolkata and Delhi, noise pollution was decreased by 50-75 db and 20-30 db, respectively in phase-I lockdown (Paital, 2020). In Bengaluru, the noise level was less than 45db in silk bored, JC road, and BTM areas. According to the West Bengal, pollution control board 50-75 % decrease in noise pollution in Kolkata, the city of joy, during the lockdown phase (NDTV, 2020).
COVID-19: impact on water quality
According to articles and media reports, lockdown for preventing COVID-19 has had a great effect on the aquatic ecosystem. The water quality of some major rivers in India including Ganga, Yamuna, Kavery, improved within a few weeks of imposing lockdown mainly due to less anthropogenic activity and closure of industries. Aquatic parameters of Ganga and Yamuna deteriorated over time due to a gradual increase in industrialization and urbanization (Chakrapani & Subramanian, 1996; Dudeja et al., 2011; Deoli et al., 2017). About 1072 industrial units, by releasing waste products, cause pollution of Ganga between Haridwar and Kanpur (Times of India, 2020a).
During pre-COVID time, 6500-6700 MLD (Million liters per day) toxic waste materials were dumped in Ganga in its UP stretch and onwards, about 10% of which is industrial waste. 100-150 tons of BOD, estimated at about 30% of the total BOD, comes from industrial toxicants (Arora et al., 2020). Despite making and executing several consecutive programs almost over the past four decades by GOVT of India, initiated with Ganga Action Plan (GAP) in 1986, then GAP –II in 1993, and recently “Namami Gange” to clean and lean Ganga, but a load of pollutants and waste keep hike on in the Ganga River but nationwide lockdown improves this situation (Times of India, 2020b).
In upstream and downstream of Ganga Barrage, the average concentration of dissolved oxygen (DO) and biological oxygen demand (BOD), were respectively 8 mg/l, 2.1 mg/l, pH 7.9 and DO (7.90), BOD (2.1 mg/l), and pH (7.9) during COVID-19 induced forced lockdown period of March 2020 (Lokhandwala & Gautam, 2020). A study aimed to analyze the complete lockdown effect on water quality of Ganga in which samples were collected and analyzed before and during lockdown from five polluted sites. It showed that the DO increased up to 25-30% and BOD decreased up to 35-40% when compared to pre-lockdown and during the lockdown (Times of India, 2020b). The Data regarding fecal coliform of five mostly crowded areas of Uttarakhand, i.e., Lakshmanjhula, Rishikesh, Bindughat, Dudhiavan, Har ki Pauri, and Jagjeetpur showed 47%, 46%, 25%, 25%, 34 %, and 27 % reduction, respectively (Hindustan times, 2020b). In the UP stretch of river Ganga, the water quality data analysis clearly showed that in a majority of the stations, DO and BOD was increased and decreased respectively in April 2020 when compared with April 2019 (Figure 3) (UPPCB, 2020). The water quality shown by 27 real-time water monitoring units out of the 36 units located along Ganga, suitable for ‘bathing’ and ‘propagation of wildlife and fisheries’ (Singhal & Matto, 2020). The upper stretch of Ganga showed the sharpest improvement. According to Uttarakhand Pollution Control Board, after more than 30 years the water of Har-ki-Pauri in Haridwar stunningly became ‘fit for drinking’ for the first time (Katariya, 2020). The sharp improvement in water quality at Haridwar and Rishikesh was due to a sudden and huge drop in the number of devotees and tourists along with a 500% decrease in sewage and industrial toxicants (Singhal & Matto, 2020). The overall water quality was also improved between Haridwar and Kanpur. A remarkable improvement was noticed during the lockdown phase across the entire stretch of Ganga, especially the up stretch of Kanpur (Dutta et al., 2020). River Yamuna, the largest arm of Ganga, also appeared more transparent, blue, and natural after many years during the lockdown. The toxic foam floated on the river surface, originated due to a mix of detergents, chemicals from industrial effluents and sewage has almost totally wiped out in southeast Delhi's Kalindi Kunj (Lokhandwala & Gautam, 2020). The water quality data collected from Palla, Nizamuddin Bridge and Okhla upstream, Najafgarh and Shahdara Drain of Yamuna River comparison during lockdown period, April 2020 when compared with the same of April 2019, clearly showed that there is a significant reduction in the value of pH, BOD and COD by 1-10 %, 30-70%, 10-70% respectively due to low pollution as a result of complete lockdown. Yamuna Pollution Monitoring Committee Report, 2020). According to the Karnataka State Pollution Control board, River Kavery and its tributaries such as Hemabati, Kabini, Shimsa also rejuvenated due to less pollution (The Hindu, 2020b).
|
|
|
Figure 3. Impact of COVID-19 lockdown on water quality of Ganga in UP stretch [Data Source- UP Pollution Control Board (uppcb.com)] |
COVID-19: effect on wild life and biodiversity
Global lockdown in the last year due to the appearance of the COVID-19 pandemic and restricted human interaction gives the wild animals and birds a free space that has never been seen before. During the complete lockdown period last year, many animals such as deers, elephants, monkeys, turtles, dolphins, and several kinds of birds were spotted very frequently. Animal behavior such as spotting of coyotes (that normally timid of traffic) on the Golden Gate Bridge in San Francisco, USA, deers are munching in Washington homes, a few miles away from the White House, wild boars are becoming bolder in Barcelona and Bergamo, Italy, peacocks have strutted through Bangor and goats through Llandudno and sheep in Wales (Loring, 2020). In North America, Killer whales have been spotted in the parts of Vancouver for the first time in decades due to less human interference (CSR News, 2020). Confining humans in their home, indicate the use of human zone by wild animals.
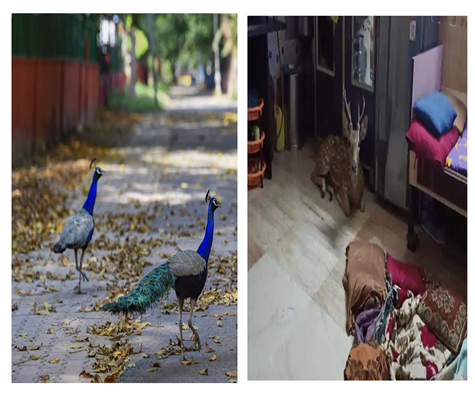
In India, the scenario is also stunning and promising for wildlife and biodiversity. A few days after implementing lockdown by Govt. of India at the end of March 2020, several wild animals were seen in urban areas, some of which are spotted after a long time. Asian antelopes, deers, Civet cats, peacocks; one-horned rhinos, and dolphins were spotted across the different cities of India. Peacocks were dancing in the streets of Mumbai, deer found in the locality (Figure 4), similarly in Kozhikode, Kerala, an Indian civet cat was spotted on the road, while a Nilgai was spotted in Noida Sector-18, Delhi, walking leisurely on the road. In Chandigarh, a sambar deer was captured while crossing a road in the city (Economic times, 2020).
The aquatic life was also been thriving due to less water pollution. Several species of fishes were observed in Kolkata ghats after 30 years (Katariya, 2020). The lockdown period coincides with the annual nesting activity of the olive ridley turtle, in different coastal regions of India such as Odisha and Maharastra, came as a blessing for this endangered animal and nearly 2 crore Olive Ridley hatchlings have emerged and successfully made their way to sea (News18, 2020a). In National Chambal Sanctuary, Agra, 3170 Gharial offspring took birth in the last hatching season, June, 2020 whereas in 2019 and 2018 the number of offspring took birth was 2919 and 2800, respectively. According to Govt. officials, less human interference due to COVID-19 lockdown results in the high natality rate of Gharials in the last hatching season (Times of India, 2020c). Large numbers of migratory birds are returning to lakes and different water bodies and migrate freely due to less human interference (Arora et al., 2020). Many bird species, which migrate from other parts of the country – known as partial migratory birds – have been extended their stay at the Therthangal and Melaselvanoor-Keelaselvanoor bird sanctuaries, Tamilnadu (The Hindu, 2020c). Reduced noise pollution makes the bird’s mating call more audible to their mates than ever before, they also flap their wings and perform the mating dance (The Hindu, 2020d). In Kolkata, one of the busiest city of India, peoples spotted, saw, and heard the calls of different kinds of birds, such as Yellow-footed green pigeon, Purple sunbird, Coppersmith barbet, and several others, may be for the first time in their locality (Basu, 2020). Brahmakamal (saussurea obvallata), a rare flower and also the state flower of Uttarakhand, India. Generally, it blooms during mid-monsoon (July-August) in high altitude (3500-4800 meters) but the flower was found to bloom in the comparatively low altitude, Garhwal of Chamoli district, Uttarakhand, India, till October 2020 due to low pollution and tourist activity as a result of COVID-19 lockdown (Times of India, 2020d).
|
|
|
Figure 4. A peacock is seen on the road at Juhu, Mumbai, during the nationwide lockdown in India; A deer crashed through the roof of a house in Mumbai [Image Source-News 18, 2020b] |
Among all these positivity for wildlife of India, a report regarding Indian wildlife amid the COVID-19 crisis indicates a hike in poaching of wild animals during the lockdown all around the country. Various cases of poaching have been reported from national parks, wildlife sanctuaries, bird sanctuaries, and others. Mainly 35 different wild animal species were targeted, of which 15 are listed in schedule I of the Wildlife Protection Act, 1972 of India. During the lockdown 88 poaching cases were reported by the media, which was significantly higher than the reported cases of poaching in pre lockdown time (TRAFFIC Report, India June 2020). However, the overall picture regarding nature and wildlife activity during this crisis period, clearly indicates that Nature presses the RE-SET button for rejuvenating itself, after experiencing that so-called nature's best creation (Human) doing nothing for it. So, we should learn from this experience and need to adapt the ways to live our lives in this post covid era so that we can use nature and its resources without harming it.
CONCLUSION
COVID-19, the largest global pandemic causing deadly threats to human life and its long-lasting, large-scale impact on human lifestyle and society may be a matter of research and arguing for the next decades. But despite several negative consequences of this pandemic, the environment healed itself during the lockdown period. All the major polluting industries were closed; vehicles are hard to be found on the road, which led to less carbon and GHG emission along with pure water in the river. Due to less pollution and a calm environment, animals were also enjoying the positive impacts of lockdown. All these positive environmental impacts may be temporary but from this situation, human beings should learn to know their limits of dominancy over nature before it is too late.
ACKNOWLEDGMENTS: I am grateful to Prof. Kousik Pramanick (Integrative Biology Research Unit, Dept. of Life Sciences, Presidency University, West Bengal, India) and Dr. Abhishek Guha (University of Alabama, Birmingham, USA) for their valuable suggestions.
CONFLICT OF INTEREST: None
FINANCIAL SUPPORT: None
ETHICS STATEMENT: None
Arora, S., Bhaukhandi, K. D., & Mishra, P. K. (2020). Coronavirus lockdown helped the environment to bounce back. Science of the Total Environment, 29, 140573.
Banerjee, D., Chakraborty, S. K., Bhattacharyya, S., & Gangopadhyay, A. (2008). Evaluation and analysis of road traffic noise in Asansol: An industrial town of eastern India. International Journal of Environmental Research and Public Health, 5(3), 165-171.
Basu, J. (2020). COVID-19: Sounds of Birds Replace Noise Pollution in Kolkata. (downtoearth.org.in)
Bouey, J. (2020, March). From SARS to 2019-Coronavirus (nCoV): US-China Collaborations on Pandemic Response: Addendum: Testimony of Jennifer Bouey, Before the US House Committee on Foreign Affairs, Subcommittee on Asia, the Pacific, and Nonproliferation, March 5, 2020. In RAND Corporation. RAND Corporation.
CDC, (2020). Symptoms of COVID-19 | CDC
Chakrapani, G. J., & Subramanian, V. (1996). Fractionation of heavy metals and phosphorus in suspended sediments of the Yamuna river, India. Environmental Monitoring and Assessment, 43(2), 117-124.
Chauhan, A., & Singh, R. P. (2020). Decline in PM2. 5 concentrations over major cities around the world associated with COVID-19. Environmental Research, 187, 109634.
Chen, Y., Liu, Q., & Guo, D. (2020). Emerging coronaviruses: Genome structure, replication, and pathogenesis. Journal of Medical Virology, 92(4), 418-423.
Cohen, A. J., Brauer, M., Burnett, R., Anderson, H. R., Frostad, J., Estep, K., Balakrishnan, K., Brunekreef, B., Dandona, L., Dandona, R., et al. (2017). Estimates and 25-year trends of the global burden of disease attributable to ambient air pollution: An analysis of data from the Global Burden of Diseases Study 2015. The Lancet, 389(10082), 1907-1918.
Cortegiani, A., Ingoglia, G., Ippolito, M., Giarratano, A., & Einav, S. (2020). A systematic review on the efficacy and safety of chloroquine for the treatment of COVID-19. Journal of Critical Care, 57, 279-283.
CSR News, (2020). Earth Day 2020 - Nature Heals During COVID-19 Lockdown - The CSR Journal.
Deoli, B. K., Bartarya, S. K., & Siddiqui, N. A. (2017). Assessment of surface and ground water quality of Haridwar district of Uttarakhand. International Journal of Chemtech Research, 10, 95-118.
Dudeja, D., Bartarya, S. K., & Biyani, A. K. (2011). Hydrochemical and water quality assessment of groundwater in Doon Valley of Outer Himalaya, Uttarakhand, India. Environmental Monitoring and Assessment, 181(1), 183-204.
Dutta, V., Dubey, D., & Kumar, S. (2020). Cleaning the River Ganga: Impact of lockdown on water quality and future implications on river rejuvenation strategies. Science of the Total Environment, 743, 140756.
Earthsky, (2020). Satellite images: Air pollution in India plummets | Earth | EarthSky.
Economic Times, (2020). Retrieved from. Coronavirus lockdown: Unusual sightings of animals in India - Nilgai in Noida | The Economic Times (indiatimes.com)
European Union, (2015). 47si.pdf (europa.eu)
GBD 2017 Risk Factor Collaborators. (2018). Global, regional, and national comparative risk assessment of 84 behavioural, environmental and occupational, and metabolic risks or clusters of risks for 195 countries and territories, 1990–2017: A systematic analysis for the Global Burden of Disease Study 2017. Lancet (London, England), 392(10159), 1923.
Global Climate Report, (2019). Retrieved from. https://www.ncdc.noaa.gov/sotc/global/201913
Gorbalenya, A. E., Baker, S. C., Baric, R., Groot, R. J. D., Drosten, C., Gulyaeva, A. A., Haagmans, B. L., Lauber, C., Leontovich, A. M., Neuman, B. W., et al. (2020). Severe acute respiratory syndrome-related coronavirus: The species and its viruses–A statement of the coronavirus study group. BioRxiv.
He, L., Zhang, S., Hu, J., Li, Z., Zheng, X., Cao, Y., Xu, G., Yan, M., & Wu, Y. (2020a). On-road emission measurements of reactive nitrogen compounds from heavy-duty diesel trucks in China. Environmental Pollution, 262, 114280.
He, M. Z., Kinney, P. L., Li, T., Chen, C., Sun, Q., Ban, J., Wang, J., Liu, S., Goldsmith, J., & Kioumourtzoglou, M. A. (2020b). Short-and intermediate-term exposure to NO2 and mortality: A multi-county analysis in China. Environmental Pollution, 261, 114165.
Hindustan Times, (2020a). Retrieved from. Covid-19: Only 4 trains operate as Railways comes to standstill amid lockdown | Latest News India - Hindustan Times.
Hindustan times, (2020b). Covid-19 lockdown: Pollution in Ganga declines as factories in UP, Uttarakhand remain shut | Latest News India - Hindustan Times.
India Times, (2020). Earth finally fixed largest ozone layer hole above arctic, healing 1 million Square Km (indiatimes.com)
India Today, (2020). Kerala reports first confirmed coronavirus case in India - India News (indiatoday.in).
India Today, (2021). Delhi breathes easy as Covid-19 lockdown lowers pollution levels again - Cities News (indiatoday.in)
Indian Express, (2021). Covid-19 second wave: Here's a list of states that have imposed lockdowns (indianexpress.com)
Katariya, M. (2020). 10 things that have happened for the first time in years during the coronavirus lockdown (scoopwhoop.com)
Kumar, P., Hama, S., Omidvarborna, H., Sharma, A., Sahani, J., Abhijith, K. V., Debele, S. E., Zavala-Reyes, J. C., Barwise, Y. & Tiwari, A. (2020). Temporary reduction in fine particulate matter due to ‘anthropogenic emissions switch-off’ during COVID-19 lockdown in Indian cities. Sustainable Cities and Society, 62, 102382.
Lal, P., Kumar, A., Kumar, S., Kumari, S., Saikia, P., Dayanandan, A., Adhikari, D., & Khan, M. L. (2020). The dark cloud with a silver lining: Assessing the impact of the SARS COVID-19 pandemic on the global environment. Science of the Total Environment, 732, 139297.
Le Quéré, C., Jackson, R. B., Jones, M. W., Smith, A. J., Abernethy, S., Andrew, R. M., De-Gol, A. J., Willis, D. R., Shan, Y., Canadell, J. G., et al. (2020). Temporary reduction in daily global CO 2 emissions during the COVID-19 forced confinement. Nature Climate Change, 10(7), 647-653.
Lokhandwala, S., & Gautam, P. (2020). Indirect impact of COVID-19 on environment: A brief study in Indian context. Environmental Research, 188, 109807.
Loring, K. (2020). In San Francisco, coyotes are your wildest neighbors | KALW
Magomedova, U. G., Khadartseva, Z. A., Grechko, V. V., Polivanova, M. N., Mishvelov, A. E., Povetkin, S. N., Demchenkov, E. L., & Shevchenko, Y. S., (2020). The role of covid-19 in the acute respiratory pathology formation in children. Pharmacophore, 11(5), 61-65.
Muhammad, S., Long, X., & Salman, M. (2020). COVID-19 pandemic and environmental pollution: A blessing in disguise? Science of the Total Environment, 728, 138820.
Myllavirta, L., & Dahiya, S. (2020). Analysis: India's CO2 emissions fall for first time in four decades amid coronavirus. Carbon Brief. Retrieved from. Analysis: India’s CO2 emissions fall for first time in four decades amid coronavirus (carbonbrief.org)
Navinya, C., Patidar, G., & Phuleria, H. C. (2020). Examining effects of the COVID-19 national lockdown on ambient air quality across urban India. Aerosol and Air Quality Research, 20(8), 1759-1771.
NEWS 18, (2020a). Watch: Hundreds of baby olive Ridley turtles make their way to sea in Odisha amid lockdown (news18.com)
NEWS 18, (2020b). Wild animals are strolling public places during coronavirus lockdown (news18.com)
Öhrström, E. (1989). Sleep disturbance, psycho-social and medical symptoms—a pilot survey among persons exposed to high levels of road traffic noise. Journal of Sound and Vibration, 133(1), 117-128.
Parishani, N., Mehraban, M. A., & Naseh, L. (2021). Nurses' views: Organizational resource consumption models in hospitals. Journal of Advanced Pharmacy Education and Research, 11(2), 156-162.
Paital, B. (2020). Nurture to nature via COVID-19, a self-regenerating environmental strategy of environment in global context. Science of the Total Environment, 139088.
Pyrc, K., Berkhout, B., & Van Der Hoek, L. (2007). Identification of new human coronaviruses. Expert Review of Anti-Infective Therapy, 5(2), 245-253.
Rabinowitz, P. (2000). Noise-induced hearing loss. American Family Physician, 61(9), 2749-2756.
Ramadan, N., & Shaib, H. (2019). Middle East respiratory syndrome coronavirus (MERS-CoV): A review. Germs, 9(1), 35.
Rivas, D. V., Pino, M. M., Rivas, S. V., Bazan, E. D., Pérez, Y. P., Campaña, Z. G., Vasquez, M. G., Carrera, C. O., Calderón, L. R., Carranza, J. P., et al. (2020). Information generation rate and its relationship with the entropy of non-linear models: Covid-19 case, Peru 2020. Journal of Biochemical Technology, 11(4), 8-14.
Rodríguez-Urrego, D., & Rodríguez-Urrego, L. (2020). Air quality during the COVID-19: PM2. 5 analysis in the 50 most polluted capital cities in the world. Environmental Pollution, 115042.
Scientific American, (2020). Why CO2 Isn't falling more during a global lockdown - Scientific American
Sharma, S., Zhang, M., Gao, J., Zhang, H., & Kota, S. H. (2020). Effect of restricted emissions during COVID-19 on air quality in India. Science of the Total Environment, 728, 138878.
Singhal, S., & Matto, M. (2020). COVID-19 lockdown: A ventilator for rivers. Down to Earth.
Somani, M., Srivastava, A. N., Gummadivalli, S. K., & Sharma, A. (2020). Indirect implications of COVID-19 towards sustainable environment: An investigation in Indian context. Bioresource Technology Reports, 11, 100491.
Stansfeld, S., Gallacher, J., Babisch, W., & Shipley, M. (1996). Road traffic noise and psychiatric disorder: Prospective findings from the Caerphilly Study. BMJ, 313(7052), 266-267.
The Gurdian, (2020). Climate crisis: In coronavirus lockdown, nature bounces back – but for how long? | Greenhouse gas emissions | The Guardian.
The Hindu, (2020a). Janata Curfew | updates - The Hindu.
The Hindu, (2020b). Cauvery, tributaries look cleaner as pandemic keeps pollution away - The Hindu.
The Hindu, (2020c). Pandemic-induced lockdown gives migratory birds and animals a reason to cheer - The Hindu.
The Hindu, (2020d). How birds' mating calls have become more audible thanks to lower noise pollution - The Hindu.
Times of India, (2020a). Lockdown curbs rejuvenate Ganga in UP ’s industrial hub | Kanpur News - Times of India (indiatimes.com)
Times of India, (2020b). How lockdown has been a gift for river Ganga - Times of India (indiatimes.com)
Times of India, (2020c). Over 3,000 critically endangered gharials born in Chambal | Agra News - Times of India (indiatimes.com)
Times of India, (2020d). Brahma kamal: Brahmakamal’s October bloom stumps experts | India News - Times of India (indiatimes.com)
TRAFFIC, (2020). Wildlife-amidst-COVID-19-India.pdf (traffic.org).
Tung, N. T., Than, N. V., Hung, N. Q., & Raal, A. (2021). The chemical investigation of four balanophora species and cytotoxicity with inhibition of NO production. International Journal of Pharmaceutical Research and Allied Sciences, 10(2), 1-9.
UPPCB, (2020). UP Pollution Control Board, Lucknow (uppcb.com)
WHO, (2005). United Nations road safety collaboration: A handbook of partner profiles.
WHO, (2016). Water, sanitation, hygiene, and waste management for SARS-CoV-2, the virus that causes COVID-19 (who.int)
WHO, (2020a). Retrieved June 14, 2021 from Coronavirus disease (COVID-19) (who.int)
WHO, (2020b). Transmission of SARS-CoV-2: Implications for infection prevention precautions (who.int)
WHO, (2020c). COVID-19 vaccine tracker and landscape (who.int)
WHO, (2020d). WHO Director-General's opening remarks at the media briefing on COVID-19 - 11 March 2020
WHO, (2021). Status_COVID_VAX_18May2021.pdf (who.int)
Wikipedia, (2020a). COVID-19 lockdowns - Wikipedia
Wikipedia, (2020b). COVID-19 lockdown in India - Wikipedia
Worldometer, (2020). Retrieved June 14, 2021 from https://www.worldometers.info/coronavirus/country/india/
Yamuna Pollution Monitoring Committee Report 2020. yamuna-revival.nic.in
Yusupova, M. I., Mantikova, K. A., Kodzokova, M. A., Mishvelov, A. E., Paschenko, A. I., Ashurova, Z. A. K., Slanova, R. H., & Povetkin, S. N. (2021). Study of the possibilities of using augmented reality in dentistry. Annals of Dental Specialty, 9(2), 17-21.
Zambrano-Monserrate, M. A., Ruano, M. A., & Sanchez-Alcalde, L. (2020). Indirect effects of COVID-19 on the environment. Science of the Total Environment, 728, 138813.
Zhong, N. S., Zheng, B. J., Li, Y. M., Poon, L. L. M., Xie, Z. H., Chan, K. H., Li, P. H., Tan, S. Y., Chang, Q., Xie, J. P., et al. (2003). Epidemiology and cause of severe acute respiratory syndrome (SARS) in Guangdong, people's Republic of China, in February, 2003. The Lancet, 362(9393), 1353-1358.
 This work is licensed under a Creative Commons Attribution 4.0 International License.