Calculation of the Correlation Coefficient of Heavy Metals of Chromium and Cadmium around Qayen Cement Plant
Nahid Sadat Nourbakhsh
Natural Resources-Environmental Engineering, Islamic Azad University Science and Research Branch, Iran.
ABSTRACT
The purpose of this study was to investigate the spatial distribution, multi-stage extraction, and distribution of heavy metals (Cr, Cd) in different sizes of sedimentary dust of Qayen cement plant along with its ecological risk assessment. For this purpose, dust sampling was carried out on 5 axes in the range of 500 to 1500 m in the predominant wind direction. Two dust samples were collected in each axis and a total of 10 dust samples. The concentrations of chromium and cadmium in fine grains of less than 63, 63-125, 125-250, 250-500, 500-1000, and 1000-2000 microns were investigated in the weak, sulfide, organic, and strong phases. According to the obtained data from this study, the highest amount of chromium was in multi-stage extraction and 500 and 1500 m distances in stations 4 and 5 and cadmium was in stations of 4. Also, the highest amount of chromium was found in all dust aggregates at the station of 5 with the distances of 500 and 1500 m and the highest amount of cadmium was in all dust aggregates of the station 4The calculation of correlation coefficients in different aggregates and different stages of chemical separation showed that there is a high correlation between chromium at 1500 m with chromium at 500 m and also cadmium at 1500 m with cadmium at 500 m..
Keywords: Heavy Metals, Cement Plant, dust, Multi-stage Extraction, Metal Correlation Coefficient
Today, environmental pollution and the dangers of increasing pollution burden as a result of advances in technology and industry have affected human societies and increased human concern (Moridi et al., 2007). The overpopulation and industrialization of societies, especially since the second half of the twentieth century, has led to the emergence of new environmental problems. Among the pollutants found in industrial wastewater, mining and urban runoff are metals. Heavy metals are soluble in water and soil, polluting surface water, groundwater, and soil, destroying the ecological balance of ecosystems. Humans and animals consuming vegetables, plants, and foods irrigated with such waters or arising from such contaminated soils, as well as animals and aquatic animals that are exposed to these metals, are affected by a variety of known or unknown diseases. Therefore, it is necessary to control and reduce the contamination of such substances in the environment (Bermejo-Barrera et al., 1994).
Air hygiene is an important environmental issue and air pollution is not confined to just one region of the world (Hoveidi, 2011). Humans and nature-produced particles and compounds are released into the atmosphere by complex chemical and physical processes and again return to the surface at the local, regional, or global scales (Mukai and Suzuki, 1996).
Metals play a vital and valuable role in industry development and technological advancement. Most of these metals are not degraded after consumption and concentrated in the environment, and if the proper balance between metals in the environment and human health is not achieved, the balance in the system's ecosystem will be destroyed and there will be numerous problems (Erfanmanesh and Afyouni, 2006). Heavy metals are among the most dangerous contaminants due to their properties such as high toxicity, stability, bioaccumulation, and bioavailability in the food chain. These elements accumulate in the body after they enter the body or are transported to higher nutritional levels and then become toxic and dangerous by chemical interactions. As such, they cause disturbances in the natural functioning of living things and can even cause death (Stewart, 1999).
Among many of the inorganic pollutants originating from human activities, heavy metals such as arsenic, cadmium, chromium, and lead are highly hazardous due to their toxicity and carcinogenicity.
The term "heavy metals" was first used by IUPAC (International Union of Pure and Applied Chemistry), but since the term contains different definitions, another term called "toxic metals" is more commonly used today. The unnecessary micronutrients include Cd, Hg, and Pb, which are not problematic for living organisms but their consumption, no-disposal, and bioaccumulation lead to poisoning.
Chromium is used to harden steel and to make stainless steel products that have useful applications. It is used for hard coatings, decorating, and preventing corrosion and rust. People receive chromium compounds through breathing, eating, drinking, and skin contact with chromium. The amount of chromium in the air and water is very low. The amount of chromium in drinking water is very low, but contaminated water may contain chromium (IV) and (VI), which are dangerous types of chromium. Most people get chromium (III) through food and change the chromium in the food. If food is stored in steel tanks or cans, the amount of chromium in the food will increase.
Cadmium enters the environment through activities such as mining, metal industries, chemicals, metalworking, superphosphate fertilizers, cadmium-containing pesticides, and the production of some metal alloys, batteries, and so on. The use of cadmium has increased significantly in the twentieth century and peaked in the last 20-30 years.
The uptake of cadmium in animals and humans causes a variety of toxic effects (eg hepatitis, bone fractures, and teratogenics). These effects generally occur at higher concentrations than the diet (Ismaili Sari, 2002). Cadmium is a highly toxic metal pollutant present in the soil that inhibits root and stem growth and crop production, affects nutrient absorption and homeostasis, and accumulates in crops. It then enters the food chain, potentially endangering the health of animals and humans. The reduction of biomass by cadmium can directly result from the inhibition of chlorophyll synthesis and photosynthesis.
Today, atmospheric dust is one of the most important sources of heavy metals, especially in urban and industrial environments (Meza-figueroa et al., 2007). Heavy metals can diffuse on a large scale by binding to dust particles. Humans are affected by heavy metals associated with dust through eating, breathing, and skin absorption of dust particles. It has been estimated that in highly dusty environments, humans consume more than 100 mg of dust daily (Mahmoudi and Khademi, 2012). In recent decades, many studies have been conducted on heavy metals in dust due to their importance and impact on the environment and humans.
Mousavi et al. (2012) in a study entitled "Investigation of Heavy Metals Distribution on Agricultural Soils Around Karun Cement Plant" stated that the process of heavy metal accumulation in surface soils around the area is as Cr> Zn> Ni> Pb> Cu> Co> Cd. Based on the results, the source of heavy metal accumulation depends on the dust-rich heavy metals produced by cement production.
Behroosh et al. (2013) carried out a study entitled "effect of aggregation on heavy metal accumulation (Cd, Cr, Pb, Zn, Cu) in surface sediments southwest of Anzali Wetland" and the concentrations of metals in the fine grains were 0.063, 0.25, 1, and 2 mm. The results of these studies showed that the concentration of all the heavy metals studied did not exceed the international standard except for cadmium, which is in the medium pollution category.
Mirzaei et al., (2013) predicted the spatial distribution of cadmium, arsenic, chromium, and copper in the surface soil of Golestan province. The results showed that the mean concentrations of cadmium, arsenic, chromium, and copper in the soil of Golestan province were 0.12, 9.1, 59.6, and 24.42 mg/kg, respectively. The soil contamination in Golestan province is not serious for these heavy metals.
Gupta and Sharma (2013) in a study entitled "The Effect of Heavy Metals on Cement Dust on Soil and Plant in Bikaner" stated that the dominant wind direction affects the distribution of heavy metals in cement dust.
Yang and Wei (2010) in different cities of China, investigated heavy metal pollution in urban soils, urban road dust, and agricultural soils. According to the measurements, the concentration of heavy metals studied was higher than the field values of China.
Al Khashman and Shawabah (2006) conducted a study entitled "Distribution of Heavy Metals in Soils Around Cement Plant in Southern Jordan". The results showed that the concentration of heavy metals in the soil around the cement plant was lower than the standard level.
With the development of industries in developing countries, air pollution is considered a serious threat to the general health of society and therefore, is one of the most important environmental and health issues of these societies. Toxic gases, pollutants, and hazardous particles released daily by the chimneys of factories and power plants in the surrounding environment have posed significant environmental challenges (Almasi et al., 2013). Due to the toxicity, stability, and specificity of the bioaccumulation of heavy metals, which is a concern of environmental researchers in the present era, this study for the first time evaluated the concentration of heavy metals in sediment samples around Qayen cement plant.
Study area
Qayen city with an area of 17.722 km2 is located in the north of South Khorasan province. Qayen's climate is strongly influenced by the highlands adjacent to the city. Operation of the Qayen Cement plant began in January 1994 and with the successful implementation of the capacity building plan, the daily production of the plant increased to 2,600 tonnes in 2006. The highest amount of clinker and cement production was achieved in 2008 with 834739 and 815624 tons of clinker and cement with 107% efficiency, respectively. Its products include Portland Cement Type 525-1, Type 425-1, Type 2, Type 5, Type 3, and Portland Pozzolanic Cement.

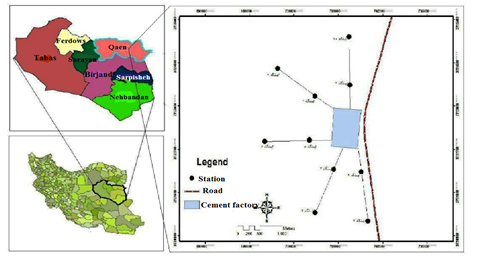
Figure 1: Map of the study area and sampling points
Drawing Wind Rose
Figure 2 shows the wind rose Qayen meteorological station in the fall and all the observation hours. The prevailing wind is east. The average wind speed is 4.96 m/s.
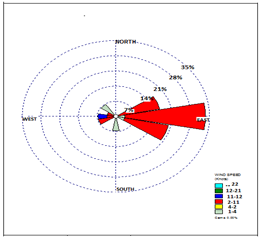
Figure 2: Wind rose Qayen Meteorological Station in the fall and all observation hours
Method of testing
The samples were collected and then dried in the open air, passed through the sieve of various sizes, and fine grains were classified as < 63, 63-125, 125-250, 250-500, 500-1000, and 1000-2000 microns. 1 g of dust samples were mixed with 60% nitric acid and digested for 24 h. The samples were heated to 80 °C for 30 min. It was then filtered and diluted to 25 ml with 1% nitric acid. Total heavy metal concentrations of chromium and cadmium were measured through atomic absorption spectrometry.
Also, using multi-step chemical separation method, which is the most reliable method for estimating contamination and the origin of the elements and their type of binding with different parts and in addition to comparing and confirming the complete decomposition method, the origin of the elements can also be investigated from the non-terrestrial and terrestrial sources. Chemical separation increases the estimation of contamination potential in sediments and was evaluated and measured in four different stages such as weak and exchangeable, acidic recovery, oxidation of organic material, and strong.
In this study, 60% nitric acid (HNO3) was used for sample preparation and determination of heavy metal concentration (Meza-Figueroa, 2007) and diluted to 25 ml with 1% nitric acid.
1 M of ammonium acetate was also used for the first stage of chemical separation. Hydroxylamine and 0.25 M hydrochloride with pH = 2 were used for the sulfide step. Hydrogen peroxide (35%) and 1 M ammonium acetate solution (pH = 3.35) were used for the oxidation of organic material. Perchloric acid and nitric acid with a ratio of 2:5 were used in the strong or residual phase.
All the materials used were from Merck German Company. Nitrocellulose filters (EEC product) with a size of 0.045 μm were used to filter the samples. Sieve in different sizes, distilled water, sampler, Whatman paper, shaker, plastic boxes, sand bath, digital scale, centrifuge, water bath, beaker, vacuum pump, Erlenmeyer flask, and other laboratory equipment were used. Descriptive statistics and correlation between data were analyzed by SPSS 16 and Excel 2007.
The total concentration of heavy metals
The mean concentration of chromium and cadmium in different stations are given in Table 1. The maximum concentration of chromium and cadmium at stations 1 and 4 were 58.74 and 1.01 mg/kg, respectively. The minimum concentration of chromium and cadmium was 29.59 and 0.28 mg/kg at stations 3 and 1, respectively. Most heavy metals at stations 1 and 4 are due to proximity to the source of pollutants or the plant's main chimney outlet, as well as the dominant wind direction of the area, most of the day being the chimney outlet towards these stations.
Table 1: Average concentration of metals at different stations
|
Cd |
Cr |
Station |
||
|
Standard deviation |
Average |
Standard deviation |
Average |
|
|
0.007 |
0.28 |
41.32 |
58.74 |
1 |
|
0.01 |
0.35 |
0.12 |
29.87 |
2 |
|
0.04 |
0.66 |
0.11 |
29.59 |
3 |
|
0.06 |
1.01 |
0.04 |
31.46 |
4 |
|
0.02 |
0.49 |
0.75 |
32.44 |
5 |
The maximum chromium content is 1500 meters at station 1 and the minimum chromium content at station 3 is 87.96 and 29.51 mg/kg, respectively. The maximum cadmium content is 1500 m at station 4 and the minimum cadmium content at station 1 is 0.97 and 0.29 mg/m3, respectively. The results of Table 1 also show that the highest amount of heavy metal at stations 1 and 4 is due to the prevailing wind direction and proximity to the main electrolyte chimney output.
Determination of Heavy Metal Concentration by 4-Step Sequential Extraction Method
The highest concentration of chromium metal at all stages (weak, sulfide, organic oxidation, and strong) was within 500 m of station 5, which was 39.65, 32.59, 28.68, and 28.95 μg/kg, respectively. The lowest chromium concentrations in the weak and strong phases of station 1 were 37.33 and 25.91 μg/kg, in the sulfide phase of station 3 was 29.3 μg/kg and in the organic oxidation step of station 2 was 25.53 μg/kg. Diagram 1 shows that the highest and lowest percentage of chromium in all stations is in the weak and the organic and strong oxidation phases, respectively.
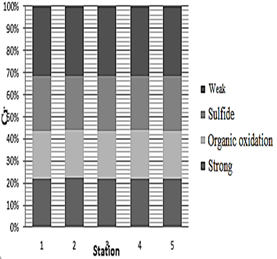
Diagram 1: Determination of chromium content in the chemical separation stages of dust within 500 m
The highest concentration of chromium metal at all stages (weak, sulfide, organic oxidation, and strong) was within 1500 m of station 5, which was 41.95, 32.48, 28.83, and 28.95 μg/kg, respectively. The lowest chromium concentration in the weak, sulfide and organic oxidation phase of station 1 was 36.78, 28.54, and 25.47 μg/kg, respectively, and in the strong phase of station 3 was 25.8 μg/kg. As the diagram 2 shows, the highest and lowest percentage of chromium in all stations is in the weak and the organic and strong oxidation phases, respectively.
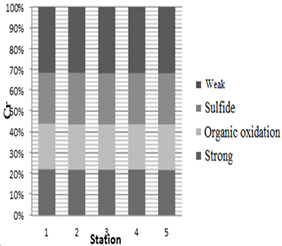
Diagram 2: Determination of chromium content in the chemical separation stages of dust within 1500 m
According to the results, the highest and lowest percentages of cadmium metal in the weak phase were at stations 2 and 5 and station 4, respectively.
Table 2: Average concentration (mg/kg) of cadmium metal within 500 m of Qayen cement plant
|
Strong |
Organic oxidation |
Sulfide |
Weak |
Station |
||||
|
Standard deviation |
Average |
Standard deviation |
Average |
Standard deviation |
Average |
Standard deviation |
Average |
|
|
0.03 |
0.24 |
0.05 |
0.19 |
0.03 |
0.3 |
0.1 |
0.4 |
1 |
|
0.05 |
0.29 |
0.05 |
0.23 |
0.02 |
0.34 |
0.36 |
0.58 |
2 |
|
0.04 |
0.62 |
0.05 |
0.57 |
0.02 |
0.68 |
0.36 |
0.91 |
3 |
|
0.23 |
0.93 |
0.22 |
0.92 |
0.25 |
1.04 |
0.31 |
0.34 |
4 |
|
0.05 |
0.4 |
0.08 |
0.32 |
0.05 |
0.49 |
0.53 |
0.83 |
5 |
According to the results, the highest percentage of cadmium in stations 2 and 5 is in the weak phase and the lowest percentage of cadmium metal in stations 1, 2, and 5 are in the organic and strong oxidation stages.
Table 3: Average concentration (mg/kg) of cadmium metal within 1500 m of Qayen cement plant
|
Strong |
Organic oxidation |
Sulfide |
Weak |
Station |
||||
|
Standard deviation |
Average |
Standard deviation |
Average |
Standard deviation |
Average |
Standard deviation |
Average |
|
|
0.02 |
0.21 |
0.04 |
0.17 |
0.03 |
0.28 |
0.09 |
0.39 |
1 |
|
0.04 |
0.26 |
0.04 |
0.22 |
0.02 |
0.33 |
0.33 |
0.54 |
2 |
|
0.03 |
0.57 |
0.04 |
0.51 |
0.34 |
0.62 |
0.33 |
0.83 |
3 |
|
0.1 |
0.85 |
0.2 |
0.84 |
0.23 |
0.96 |
0.28 |
1.23 |
4 |
|
0.07 |
0.35 |
0.08 |
0.29 |
0.04 |
0.47 |
0.48 |
0.77 |
5 |
Calculation of the correlation coefficient of chromium and cadmium heavy metals in the study area
The correlation coefficients of the heavy metals studied around the Qayen cement plant are shown in Table 4. Table 4 shows a high correlation (r = 0.999) in the aggregation of 63-micron chromium at 1500 m with chromium at 500 m and also a high correlation (r = 0.999) at cadmium at 1500 m with cadmium at 500 m. At aggregation size of 125-163 micron, chromium is highly correlated at 1500 m with chromium at 500 m (r = 0.999), cadmium at 500 m distance with chromium at 500 m and chromium at 1500 m distance had a moderate to high correlation (r = 0.672) (r = 0.670), cadmium at 1500 m distance with chromium at 500 m and 1500 m distance had moderate to high correlation (r = 0.674) (r = 0.673), and cadmium at 1500 m distance was strongly correlated with cadmium at 500 m distance (r = 0.999). At aggregation size of 125-250 micron, chromium is highly correlated at 1500 m with chromium at 500 m (r = 1), cadmium at 500 m with chromium at 500 and 1500 m had a moderate to high correlation (r = 0.654), (r = 0.648), cadmium at 1500 m distance with chromium at 500 and 1500 m distance had moderate to high correlation (r = 0.653) (r = 0.648), cadmium at 1500 m distance was strongly correlated with cadmium at 500 m distance (r = 0.999). At aggregation size of 250-500 micron, chromium is highly correlated at 1500 m with chromium at 500 m (r = 0.998), cadmium at 500 m with chromium at 500 and 1500 m had a moderate to high correlation (r = 0.622), (r = 0.629), cadmium at 1500 m distance with chromium at 500 and 1500 m distance had a moderate to high correlation (r = 0.631) (r = 0.639), cadmium at 1500 m distance was strongly correlated with cadmium at 500 m distance (r = 0.999). At aggregation size of 500-1000 mm, chromium is highly correlated at 1500 m with chromium at 500 m (r = 0.995), cadmium at 500 m with chromium at 500 and 1500 m had a moderate to high correlation (r = 0.532), (r = 0.555), cadmium at 1500 m distance with chromium at 500 and 1500 m distance had moderate to high correlation (r = 0.538) (r = 0.553), cadmium at 1500 m distance was strongly correlated with cadmium at 500 m distance (r = 0.999). At aggregation size of 1000-2000 micron, only chromium at 1500 m distance with chromium at 500 m and cadmium at 1500 m distance with cadmium at 500 m distance showed high correlation (r = 0.998), (r = 0.993). Khaksarnejad et al. (2014) studied correlations between metals in a study of heavy metals concentration around the Qayen cement plant and concluded that there was a high correlation between metals. In a study of soil around the mega cement plant, Eggankel et al. concluded that the correlation between cadmium and chromium was negatively correlated (r = - 0.383) at the 0.05% level.
As the results show, there is a high or medium to the high correlation between the metals, indicating that these metals are likely to have a common origin and can enter the environment through the dust generated by the plant.
Table 4: Correlation between heavy metals in different aggregates of dust particles around Qayen cement plant
|
Particle size (micron) |
500 Cr |
1500 Cr |
500 Cd |
1500 Cd |
|
|
63> |
500 Cr |
1 |
|
|
|
|
|
1500 Cr |
0.999** |
1 |
|
|
|
|
500 Cd |
0.419 |
0.415 |
1 |
|
|
|
1500 Cd |
0.431 |
0.427 |
0.999** |
1 |
|
63-125 |
500 Cr |
1 |
|
|
|
|
|
1500 Cr |
0.999** |
1 |
|
|
|
|
500 Cd |
0.672** |
0.670** |
1 |
|
|
|
1500 Cd |
0.674** |
0.673** |
0.999** |
1 |
|
125-250 |
500 Cr |
1 |
|
|
|
|
|
1500 Cr |
1** |
1 |
|
|
|
|
500 Cd |
0.654** |
0.648** |
1 |
|
|
|
1500 Cd |
0.653** |
0.648** |
0.999** |
1 |
|
250-500 |
500 Cr |
1 |
|
|
|
|
|
1500 Cr |
0.998** |
1 |
|
|
|
|
500 Cd |
0.622** |
0.629** |
1 |
|
|
|
1500 Cd |
0.631** |
0.639** |
0.999** |
1 |
|
500-1000 |
500 Cr |
1 |
|
|
|
|
|
1500 Cr |
0.995** |
1 |
|
|
|
|
500 Cd |
0.532** |
0.555* |
1 |
|
|
|
1500 Cd |
0.528* |
0.553* |
0.999** |
1 |
|
1000-2000 |
500 Cr |
1 |
|
|
|
|
|
1500 Cr |
0.998** |
1 |
|
|
|
|
500 Cd |
0.203 |
0.219 |
1 |
|
|
|
1500 Cd |
0.246 |
0.261 |
0.993** |
1 |
|
**. Correlation is significant at the 0.01 level (2-tailed). |
|
|
|||
|
*. Correlation is significant at the 0.05 level (2-tailed). |
|
|
|||
Table 5 shows that there is a high correlation (r = 0.998) between the chromium at 1500 and 500 m in the weak phase, also, cadmium at 500 m distance with chromium at 500 and 1500 m distance had moderate to high correlation (r = 0.674), (r = 0.683). Cadmium at 1500 m distance with chromium at 500 and 1500 m distance showed moderate to high correlation (r = 0.682), (r = 0.691). At this stage, cadmium at 1500 m distance was strongly correlated with cadmium at 500 m distance (r = 1). In the sulfide phase, only chromium at 1500 m distance with chromium at 500 m and cadmium at 1500 m distance with cadmium at 500 m distance showed high correlation (r = 0.998), (r = 0.996). In the organic oxidation stage, chromium at 1500 m distance with chromium at 500 m distance showed high correlation (r = 0.995), also, cadmium is moderately correlated with chromium at 500 and 1500 m, (r = 0.416) (r = 0.420), respectively, and cadmium is highly correlated with chromium at 1500 and 500 m, (r = 0.999), respectively. In the strong phase, chromium at 1500m distance with chromium at 500m distance and cadmium at 1500 m distance with cadmium at 500m distance showed high correlation (r = 0.999), (r = 0.997), respectively. At this stage, cadmium at 1500 m distance is only slightly correlated with chromium at 500 m distance (r = 0.364).
Table 5: Correlation between heavy metals in chemical separation steps of dust particles around Qayen cement plant
|
Multi-step decomposition |
500 Cr |
1500 Cr |
500 Cd |
1500 Cd |
|
|
Weak |
500 Cr |
1 |
|
|
|
|
|
1500 Cr |
0.998** |
1 |
|
|
|
|
500 Cd |
0.674** |
0.683** |
1 |
|
|
|
1500 Cd |
0.682** |
0.691** |
1** |
1 |
|
Sulfide |
500 Cr |
1 |
|
|
|
|
|
1500 Cr |
0.998** |
1 |
|
|
|
|
500 Cd |
0.298 |
0.303 |
1 |
|
|
|
1500 Cd |
0.294 |
0.299 |
0.996** |
1 |
|
Organic oxidation |
500 Cr |
1 |
|
|
|
|
|
1500 Cr |
0.995** |
1 |
|
|
|
|
500 Cd |
0.416* |
0.420* |
1 |
|
|
|
1500 Cd |
0.412* |
0.419* |
0.999** |
1 |
|
Strong |
500 Cr |
1 |
|
|
|
|
|
1500 Cr |
0.999** |
1 |
|
|
|
|
500 Cd |
0.348 |
0.341 |
1 |
|
|
|
1500 Cd |
0.364* |
0.359 |
0.997** |
1 |
|
**. Correlation is significant at the 0.01 level (2-tailed). |
|
|
|||
|
*. Correlation is significant at the 0.05 level (2-tailed). |
|
|
|||
Cement dust, also impregnated with heavy metals, spreads over a wide area through the wind, rain, etc., and accumulates inside and on plants, animals, and soil, and may have many negative effects on human health. Exhaust gases from the cement plant in addition to sulfur dioxide, nitrogen oxides, and carbon dioxide also contain heavy metals and their concentrations are dangerous to the environment (Amir Hosseini et al., 2010).
In this research, dust from different industries, especially cement plants, due to the importance of heavy metals in dust has been investigated in different researches. Heavy metals in the human body can accumulate in the tissues and affect the nervous system and blood circulation.
This study was carried out on surface soils around Qayen cement plant and according to Table 1 data, the highest concentration of chromium and cadmium in stations 1 and 4 were 58.74 and 1.01 mg/kg, respectively, and the lowest concentration of chromium and cadmium metals were 29.59 and 0.28 mg/kg at stations 3 and 1, respectively.
This indicates that the highest amount of dust emitted by the Qayen Cement Plant sits at stations of 1 and 4. It should be noted that given that most of the time the cement plant's chimney output is towards these stations, the contaminants accumulation in the stations will probably be higher.
The maximum amount of chromium and cadmium are 1500 m at stations 1 and 4 and the minimum chromium and cadmium are 1500 m at stations 3 and 4. Also, the maximum amount of chromium and cadmium is 500 m at stations 5 and 4 and the minimum chromium and cadmium are 500 m at station 1.
These results indicate that the cadmium metal in the surface soil sits at both distances of 1500 and 500 m at station 4. It also settles on surface soils at a maximum of 1500 m at station 1 and 500 m at station 5. These results also indicate that there are more deposition and accumulation of heavy metals at stations 1 and 5, which is due to the prevailing wind direction of the area and the output of the factory chimney during the day.
Also, according to the results of measurement of chromium and cadmium concentration by multi-stage extraction method (weak, sulfide, organic oxidation, strong) in Tables 3 and 4, the highest amount of chromium deposition in surface soils is at 500 and 1500 m from the plant at all extraction stages at station 5. According to Tables 5 and 6, the highest amount of cadmium metal deposition in surface soils is between 500 and 1500 m from stations 3 and 4.
According to the results of concentrations of chromium and cadmium based on different dust aggregates, (<63, 63-125, 125-250, 250-500, 500-1000, 1000-2000 microns) of Tables 7 and 6, maximum deposition of chromium is between 500 and 1500 m at station 5. Also, the highest amount of cadmium metal deposition is at 500 and 1500 m distances from the plant at station 4. These results also show that we have the highest level of pollution at stations 4 and 5 and within 500 meters due to the prevailing wind direction and chimney outlet.
Correlation coefficients in different aggregates and chemical separation stages showed a high correlation between chromium at 1500 and 500 m and cadmium at 1500 and 500 m.
According to the wind rose map and the dominant eastern wind direction of autumn and the results of sampling stations (maps 1 to 5), the highest amount of chromium and cadmium were found at stations 7, 8, 9, 10, respectively, towards the plant's green belt and close to the arable land under study.
REFERENCES